Introduction: Accessibility and Travel Sustainability
What is Accessibility in Urban Planning?
Accessibility measures the ease with which you can reach key travel destinations, such as shops, schools and workplaces, by different modes of transport, taking into account land use and transport infrastructure. It tells us how well connected places are, and has various economic, social and sustainability impacts. ENHANCE Cities focusses on sustainable travel modes — public transport, walking and cycling — and how the quality and competitiveness of these sustainable modes can help create better connected and healthier places.
Recently a series of high quality national-level accessibility datasets have been created, which enable accessibility analysis to be used more widely in urban planning. The Department for Transport Connectivity Metrics measure accessibility by public transport, car, walking and cycling to major destination types: Employment, Education, Health, Leisure & Shopping. Travel cost is analysed in terms of travel time, taking into account important factors such as public transport services, road congestion, and accessibility variation at different times of day (the full DfT methodology is here).
The chart below shows the DfT Public Transport Connectivity Metric for city regions in England and Wales, at the data scale of local authorities. Large high-density city regions with metro systems have higher accessibility, led by London, followed by Manchester, Birmingham and Liverpool-
There is variation within city regions between the more accessible urban core authorities — such as Newcastle, Bristol and Nottingham — and the wider region, particularly in combined authorities that include rural areas, such as the North East and East Midlands. Leeds and Sheffield have lower results than comparable cities, which mainly reflects their local authority boundaries including rural areas, but in the case of Leeds is also likely linked to the need for a metro system. Note the DfT Connectivity Metrics are for England and Wales only. For Scottish accessibility data see the UBDC Great Britain Accessibility Indicators.
Accessibility and Travel Sustainability
Accessibility is a measure of the opportunities to travel by different modes of transport. For the wider application of accessibility in sustainable planning, we need to demonstrate that good accessibility by sustainable travel modes can translate into actual sustainable travel behaviour, i.e. less car-dependent lifestyles. This is indeed the case for England and Wales as shown in the chart below-
On the x-axis is the DfT Public Transport Connectivity Metric that we discussed above. Authorities in more accessible cities appear on the right of the chart, with smaller towns and more rural areas on the left. The Travel Sustainability Index on the y-axis is a measure of travel behaviour, using car ownership and journey-to-work data from the 2021 census. Car dependent authorities appear at the bottom of the chart, and public transport and active travel oriented authorities towards the top. Circle size is proportional to local authority population.
We can see a broad positive correlation between public transport accessibility and sustainable travel. London boroughs are at the top right, displaying high transit accessibility and the most sustainable patterns. Public transport oriented metropolitan authorities outside of London — such as Manchester, Liverpool and Newcastle — have moderately sustainable travel patterns and good accessibility, and are positioned just behind Outer London boroughs on the chart. Active travel oriented cities — such as Brighton and Cambridge — have higher than expected travel sustainability given their accessibility levels, and are positive outliers in the chart. Car-dependent patterns dominate for the majority of authorities, including smaller urban settlements and rural authorities at low and medium accessibility levels. Note, this analysis is not saying that there is simple causal relationship between accessibility and travel behaviour — demographics, urban form and other factors affect travel behaviour — but rather that good accessibility by sustainable modes is a necessary condition for sustainable travel outcomes.
Using the Mapping Tool to Explore Sustainable Travel Patterns
The ENHANCE Cities Mapping Tool allows you to explore accessibility and travel sustainability indicators for England and Wales, from the national to the neighbourhood scale. Here we are going to use the mapping tool to explore leading public transport cities in England. These are the cities that appear towards the top-right of the chart above, where sustainable behaviour is being driven by good public transport accessibility. Outside of London, these cities include Manchester, Liverpool, Nottingham and Newcastle. These authorities have all invested in metro and bus networks, and have relatively high-density urban cores.
Metropolitan Example: Greater Manchester
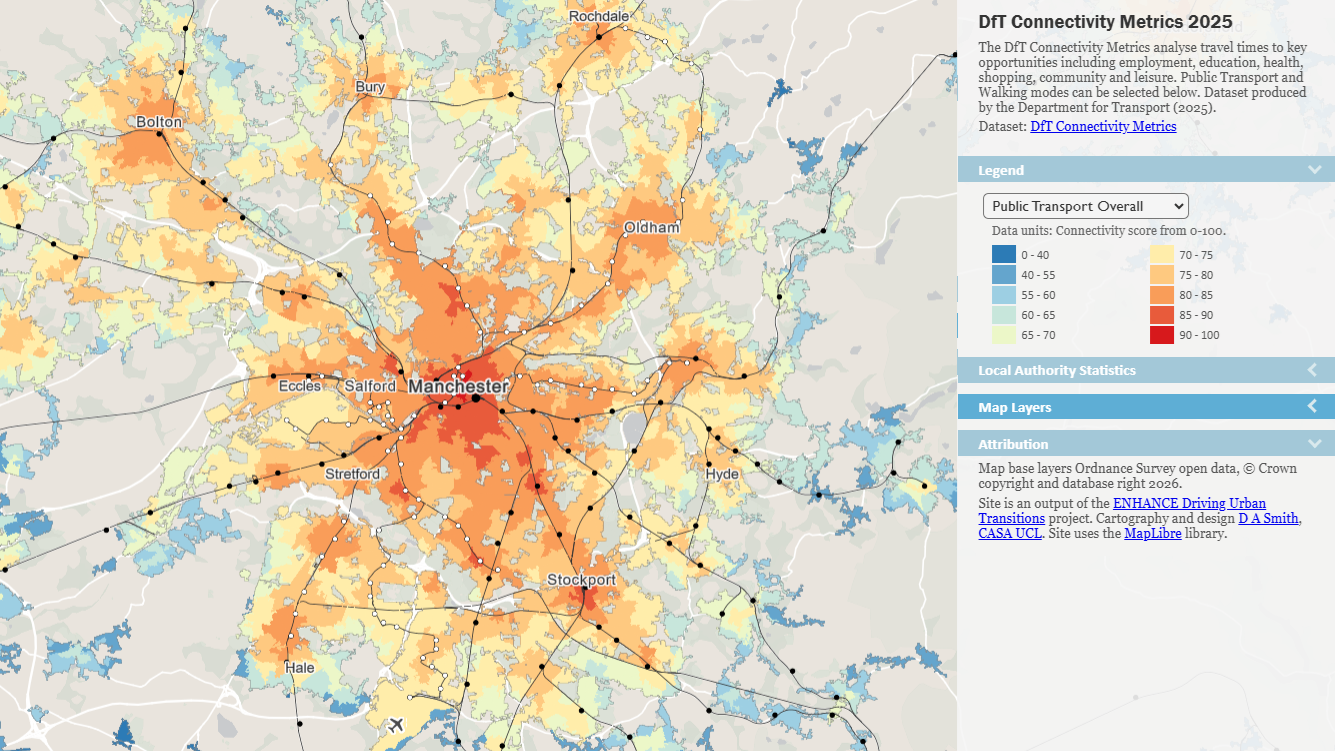
Greater Manchester is the fastest growing metropolitan area in the UK. Urban development has been focussed on Inner Manchester, integrated with the region's Metrolink tram network and bus services. Below we can see the map of the DfT Public Transport Connectivity measure for Greater Manchester (click the link to go to the Mapping Tool), with rail and tram lines overlaid, showing strong accessibility across the region. Manchester has the highest public transport accessibility of any local authority outside of London by the DfT measure.
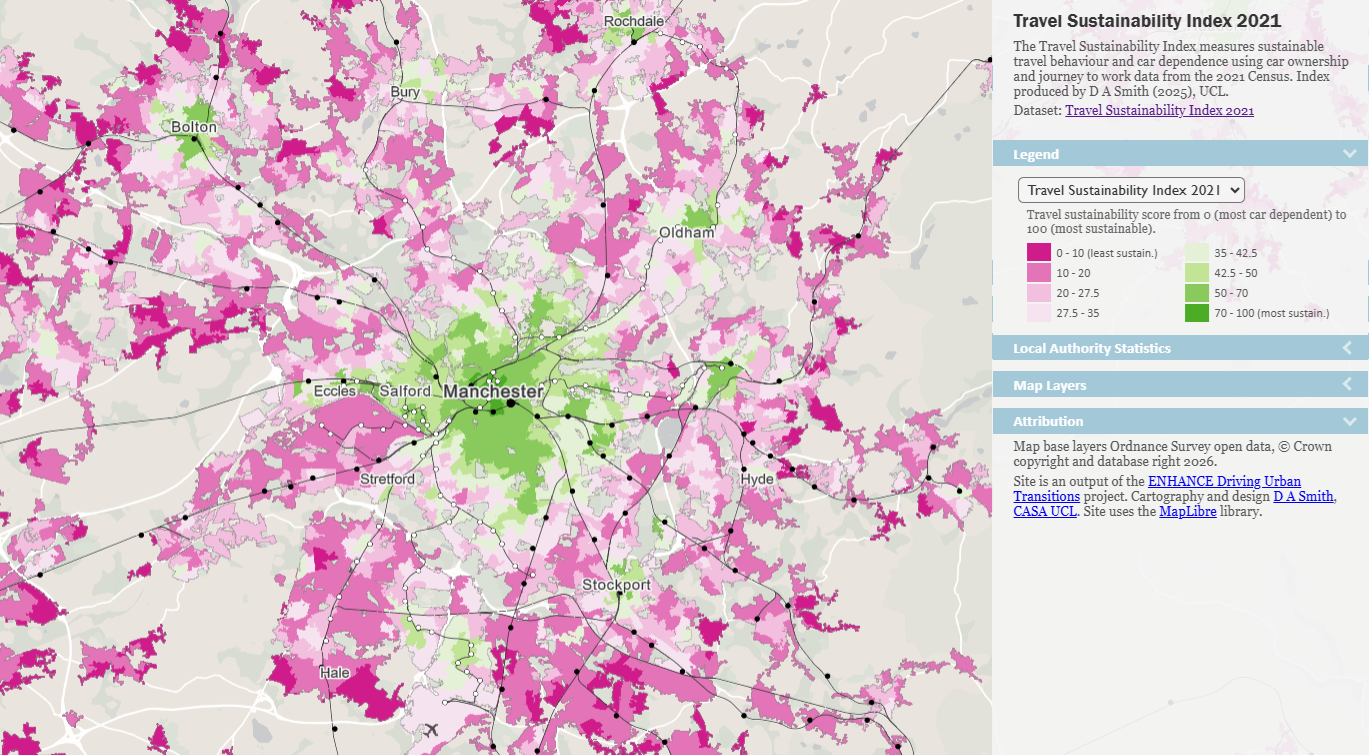
We can then compare the public transport accessibility map for Greater Manchester to the Travel Sustainability Index map. Sustainable travel patterns can be seen in the inner-city boroughs of Manchester and Salford. For example in the local authority of Manchester, 39% of households do not own a car, 20% of households commute by public transport and 18% by walking & cycling (2021 Census data). Again, these are amongst the most sustainable results outside of London. In the Greater Manchester region, more sustainable patterns are confined to metropolitan centres such as Bolton, Oldham and Stockport, while suburban areas are largely car dependent, particularly at the urban fringe. This analysis supports further inner-city densification and public transport expansion to improve accessibility and travel sustainability in Greater Manchester.
Medium-Sized City Example: Nottingham
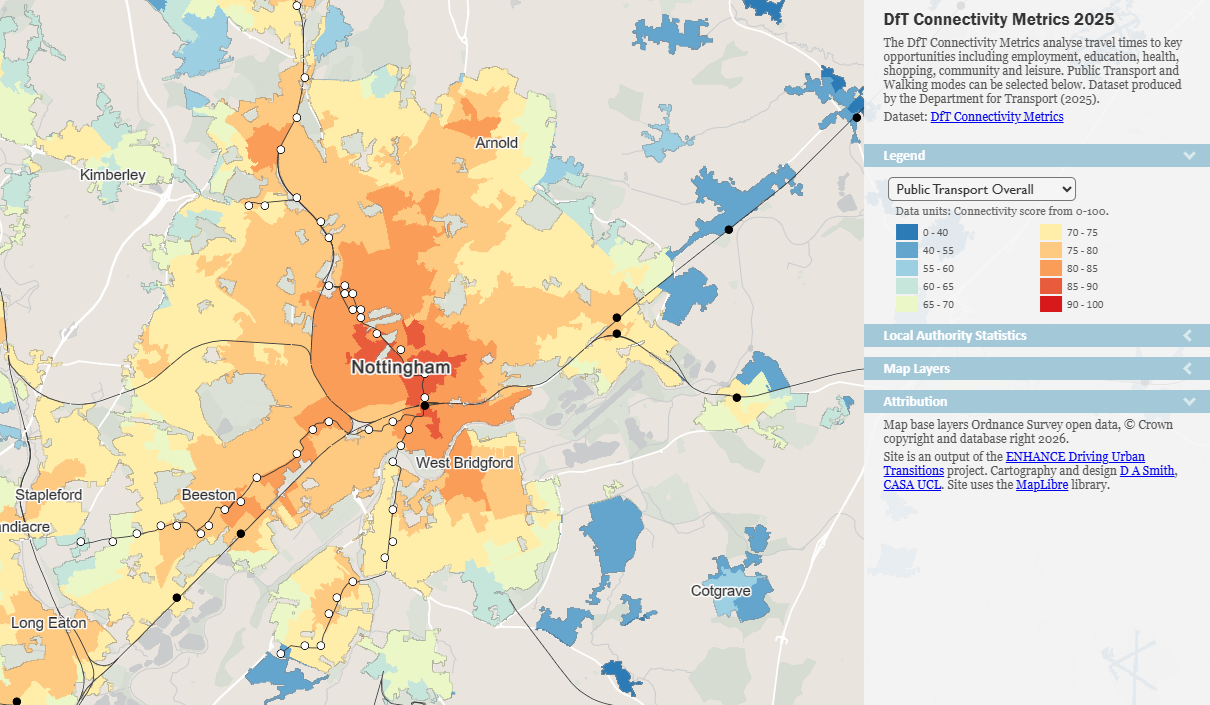
Larger cities generally have the economies of scale to invest in public transport networks, and challenges can be greater for smaller cities. There are however some good examples of sustainable travel patterns in medium-sized cities. Nottingham has a compact medium-density form, and has invested in several tram lines as shown in the Public Transport Connectivity map. Additionally, Nottingham has a very good bus network (Nottingham was one of the few authorities to avoid public transport privitisation), which delivers good public transport accessibility across the city.
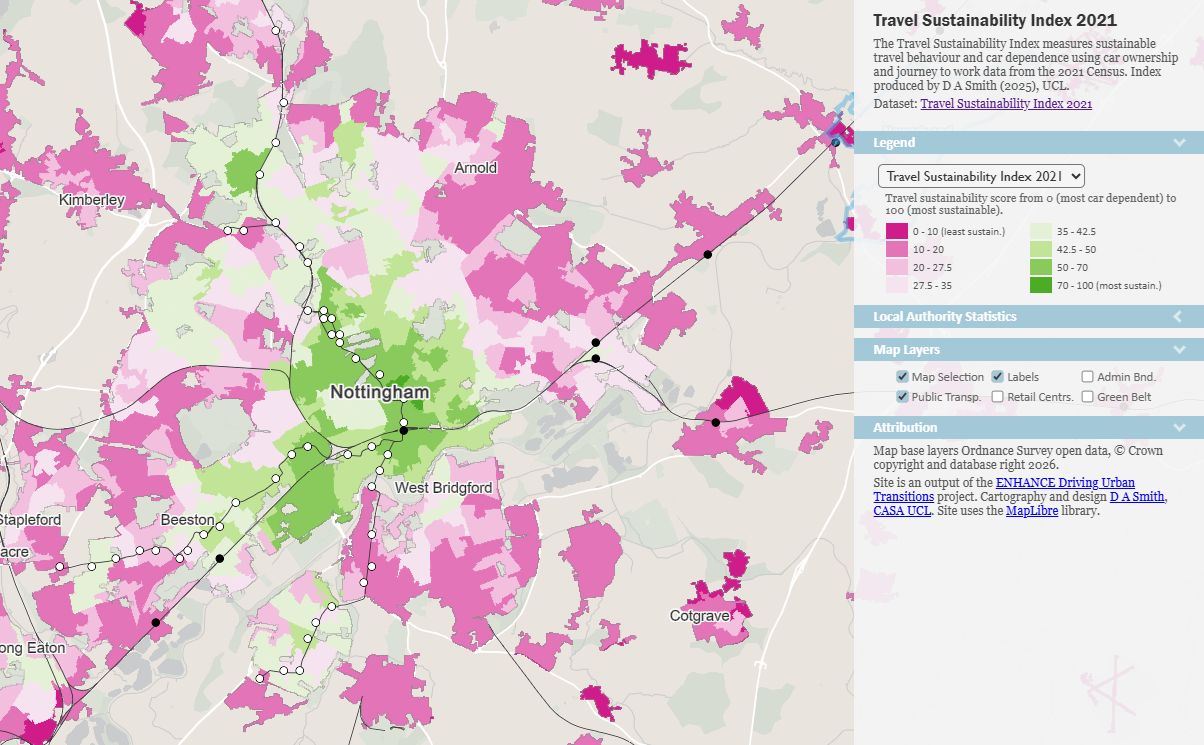
More sustainable travel patterns can be seen in the urban core of Nottingham and also in several suburban areas, particularly those served by the tram lines. The overall travel figures for Nottingham local authority are 38% of households car free, 20% of commuting by public transport and 18% of commuting by active travel. The map analysis indicates that expansion of the tram network could further improve travel sustainability patterns, particularly to the north-east and south-east of the city.
Summary
Accessibility measures how well connected locations are, and can be used in urban planning to assess the opportunities for sustainable travel. London has by far the highest accessibility in England, but other metropolitan authorities such as Manchester, Liverpool, Nottingham and Newcastle also score well. The ENHANCE Mapping Tool allows you to explore accessiblity and sustainable travel datasets at a range of spatial scales.
High public transport accessibility is correlated with lower car ownership and more sustainable commuting patterns in England and Wales, while the majority of rural and smaller urban areas are highly car dependent.
Leading cities for sustainable travel have all invested in good quality metro and bus networks. The mapping analysis suggests there is significant potential for further expanding urban tram and bus networks to improve performance.
Leading active travel cities achieve significantly higher than expected travel sustainability outcomes given their level of public transport accessibility. Leading authorities include Cambridge, Oxford, Brighton and Norwich. Active travel is discussed further in the next article on Active Travel and the 15 Minute City.
The ENHANCE Project is funded by ESRC and is part of the Driving Urban Transitions network. |
 |
 |
 |
 |