New Build Development and Accessibility
As well as analysing current levels of accessibility, it is also important to look at how accessibility is changing through processes of urban development, and the sustainability of new areas created through planning. This article firstly looks at data on patterns of housing development in the last 15 years, and then considers potential patterns of future development using data on the geography of development sites.
New Build Housing Totals 2012-2026
Using Energy Performance Certificate data, we can map all new build housing development in England and Wales since 2012. The chart below shows the authorities with the highest rates of development during this period, which are a mix of inner city boroughs and some large rural authorities. Tower Hamlets in East London and Salford in Greater Manchester have the highest development rates relative to population. Birmingham, Leeds and Manchester have high absolute development levels, although these results are more moderate when normalised by population. Rural authorities with high development include North Yorkshire and Cornwall, while there are some South East authorities with relatively high development, including Milton Keynes and Buckinghamshire-
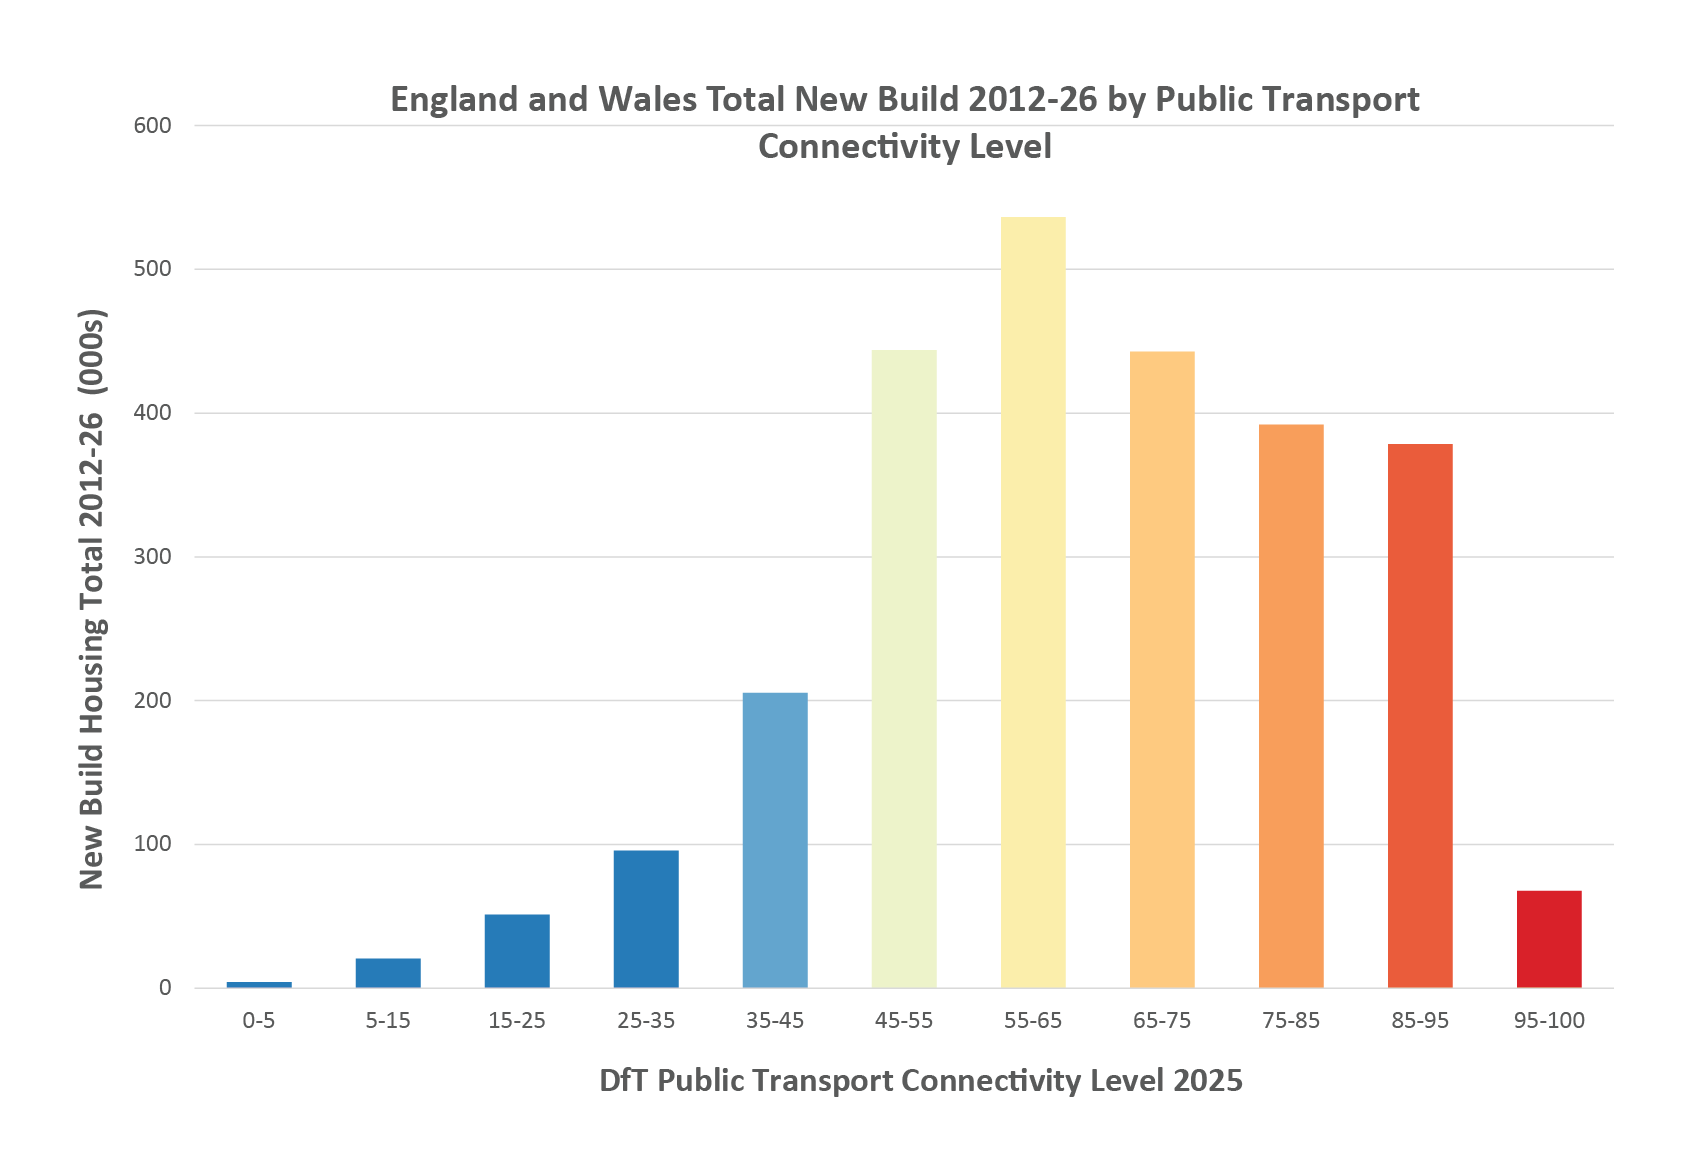
From the perspective of sustainable development, a high proportion of development should be in urban areas with good public transport accessibility. By combining the EPC new build data with the DfT Public Transport Connectivity metric we can measure the accessibility levels of all the new build development between 2012-26. The chart below shows this data, with new build mainly between Connectivity levels of 40-80, with an overall average of 64. Levels of 70 and above are in larger urban areas and are generally more sustainable, while results below 60 and typically very car dependent (see article on Accessibility and Travel Sustainbility). Therefore this result is mixed in sustainable development terms, with a range of public transport oriented and car dependent development -
Mapping Spatial Patterns of New Build Housing and Public Transport
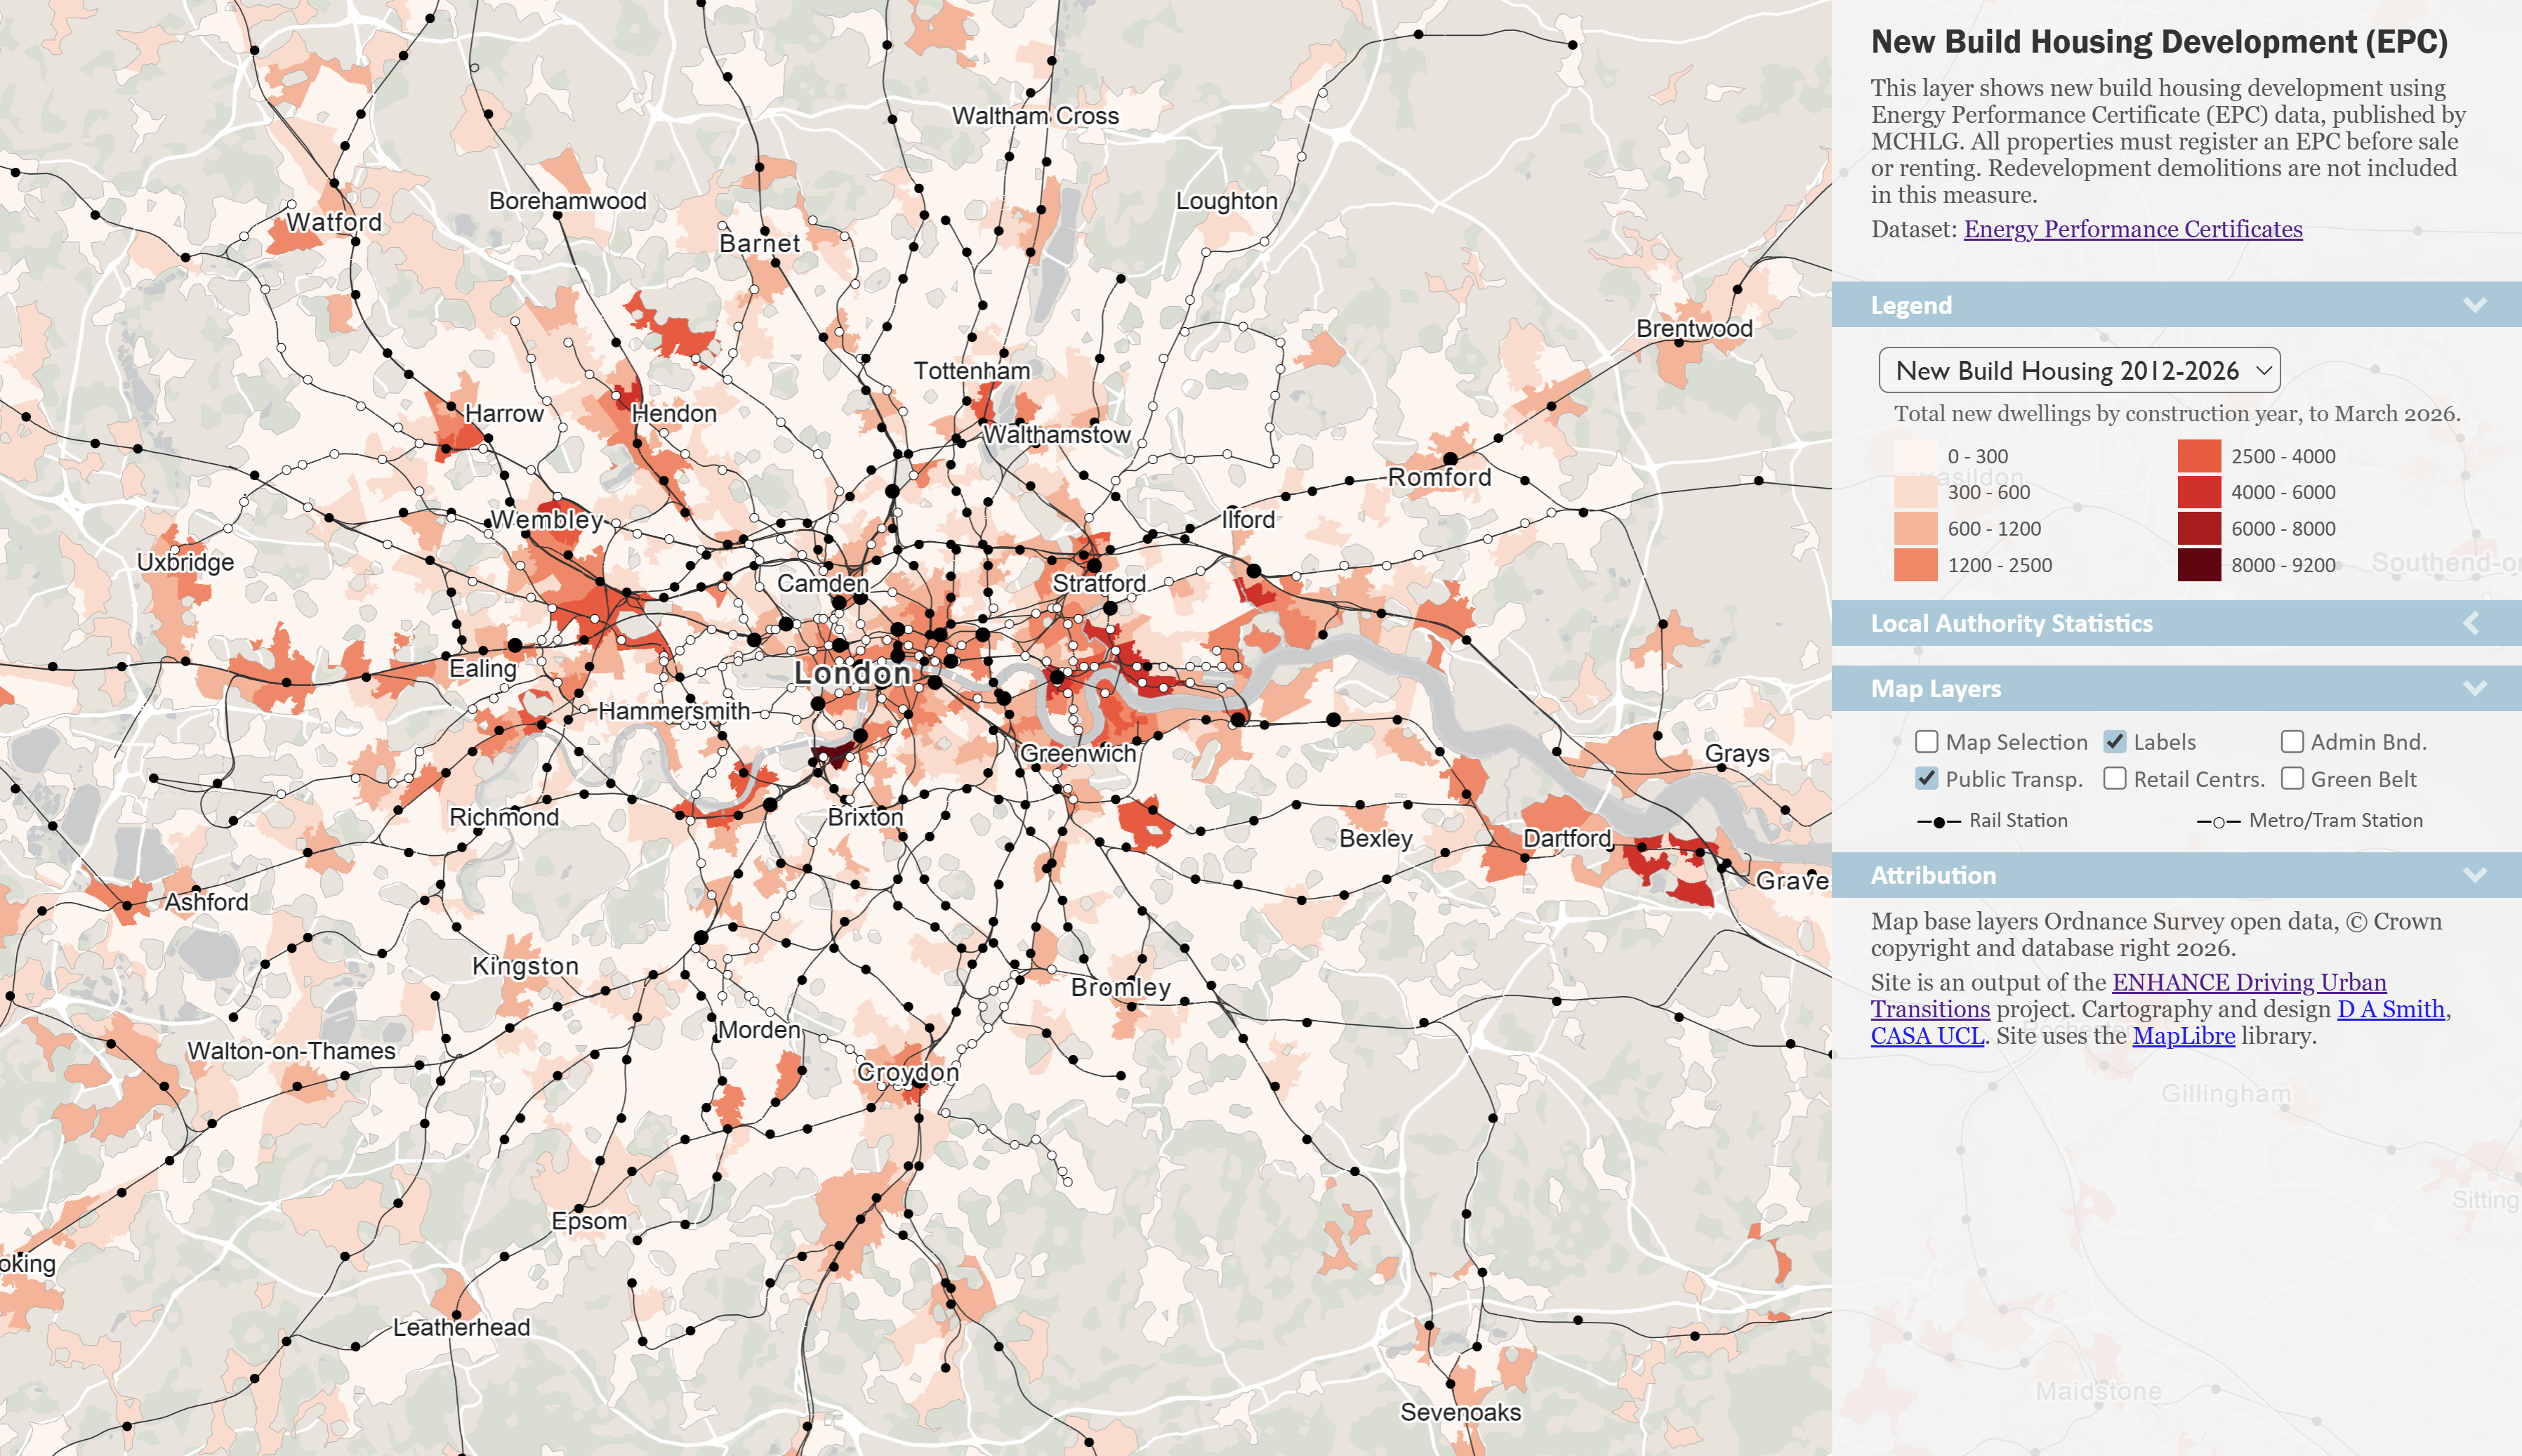
We can also explore the integration of housing development and public transport infrastructure by mapping the EPC data using the ENHANCE Mapping Tool. For example, Greater London has through the London Plan ensured that development is closely integrated with public transport stations for the last two decades, and the mapping analysis highlights this integration. Large development areas can be identified such as Battersea, Park Royal and the various stages of the Thames Gateway in East London, from Canary Wharf to Barking Riverside-
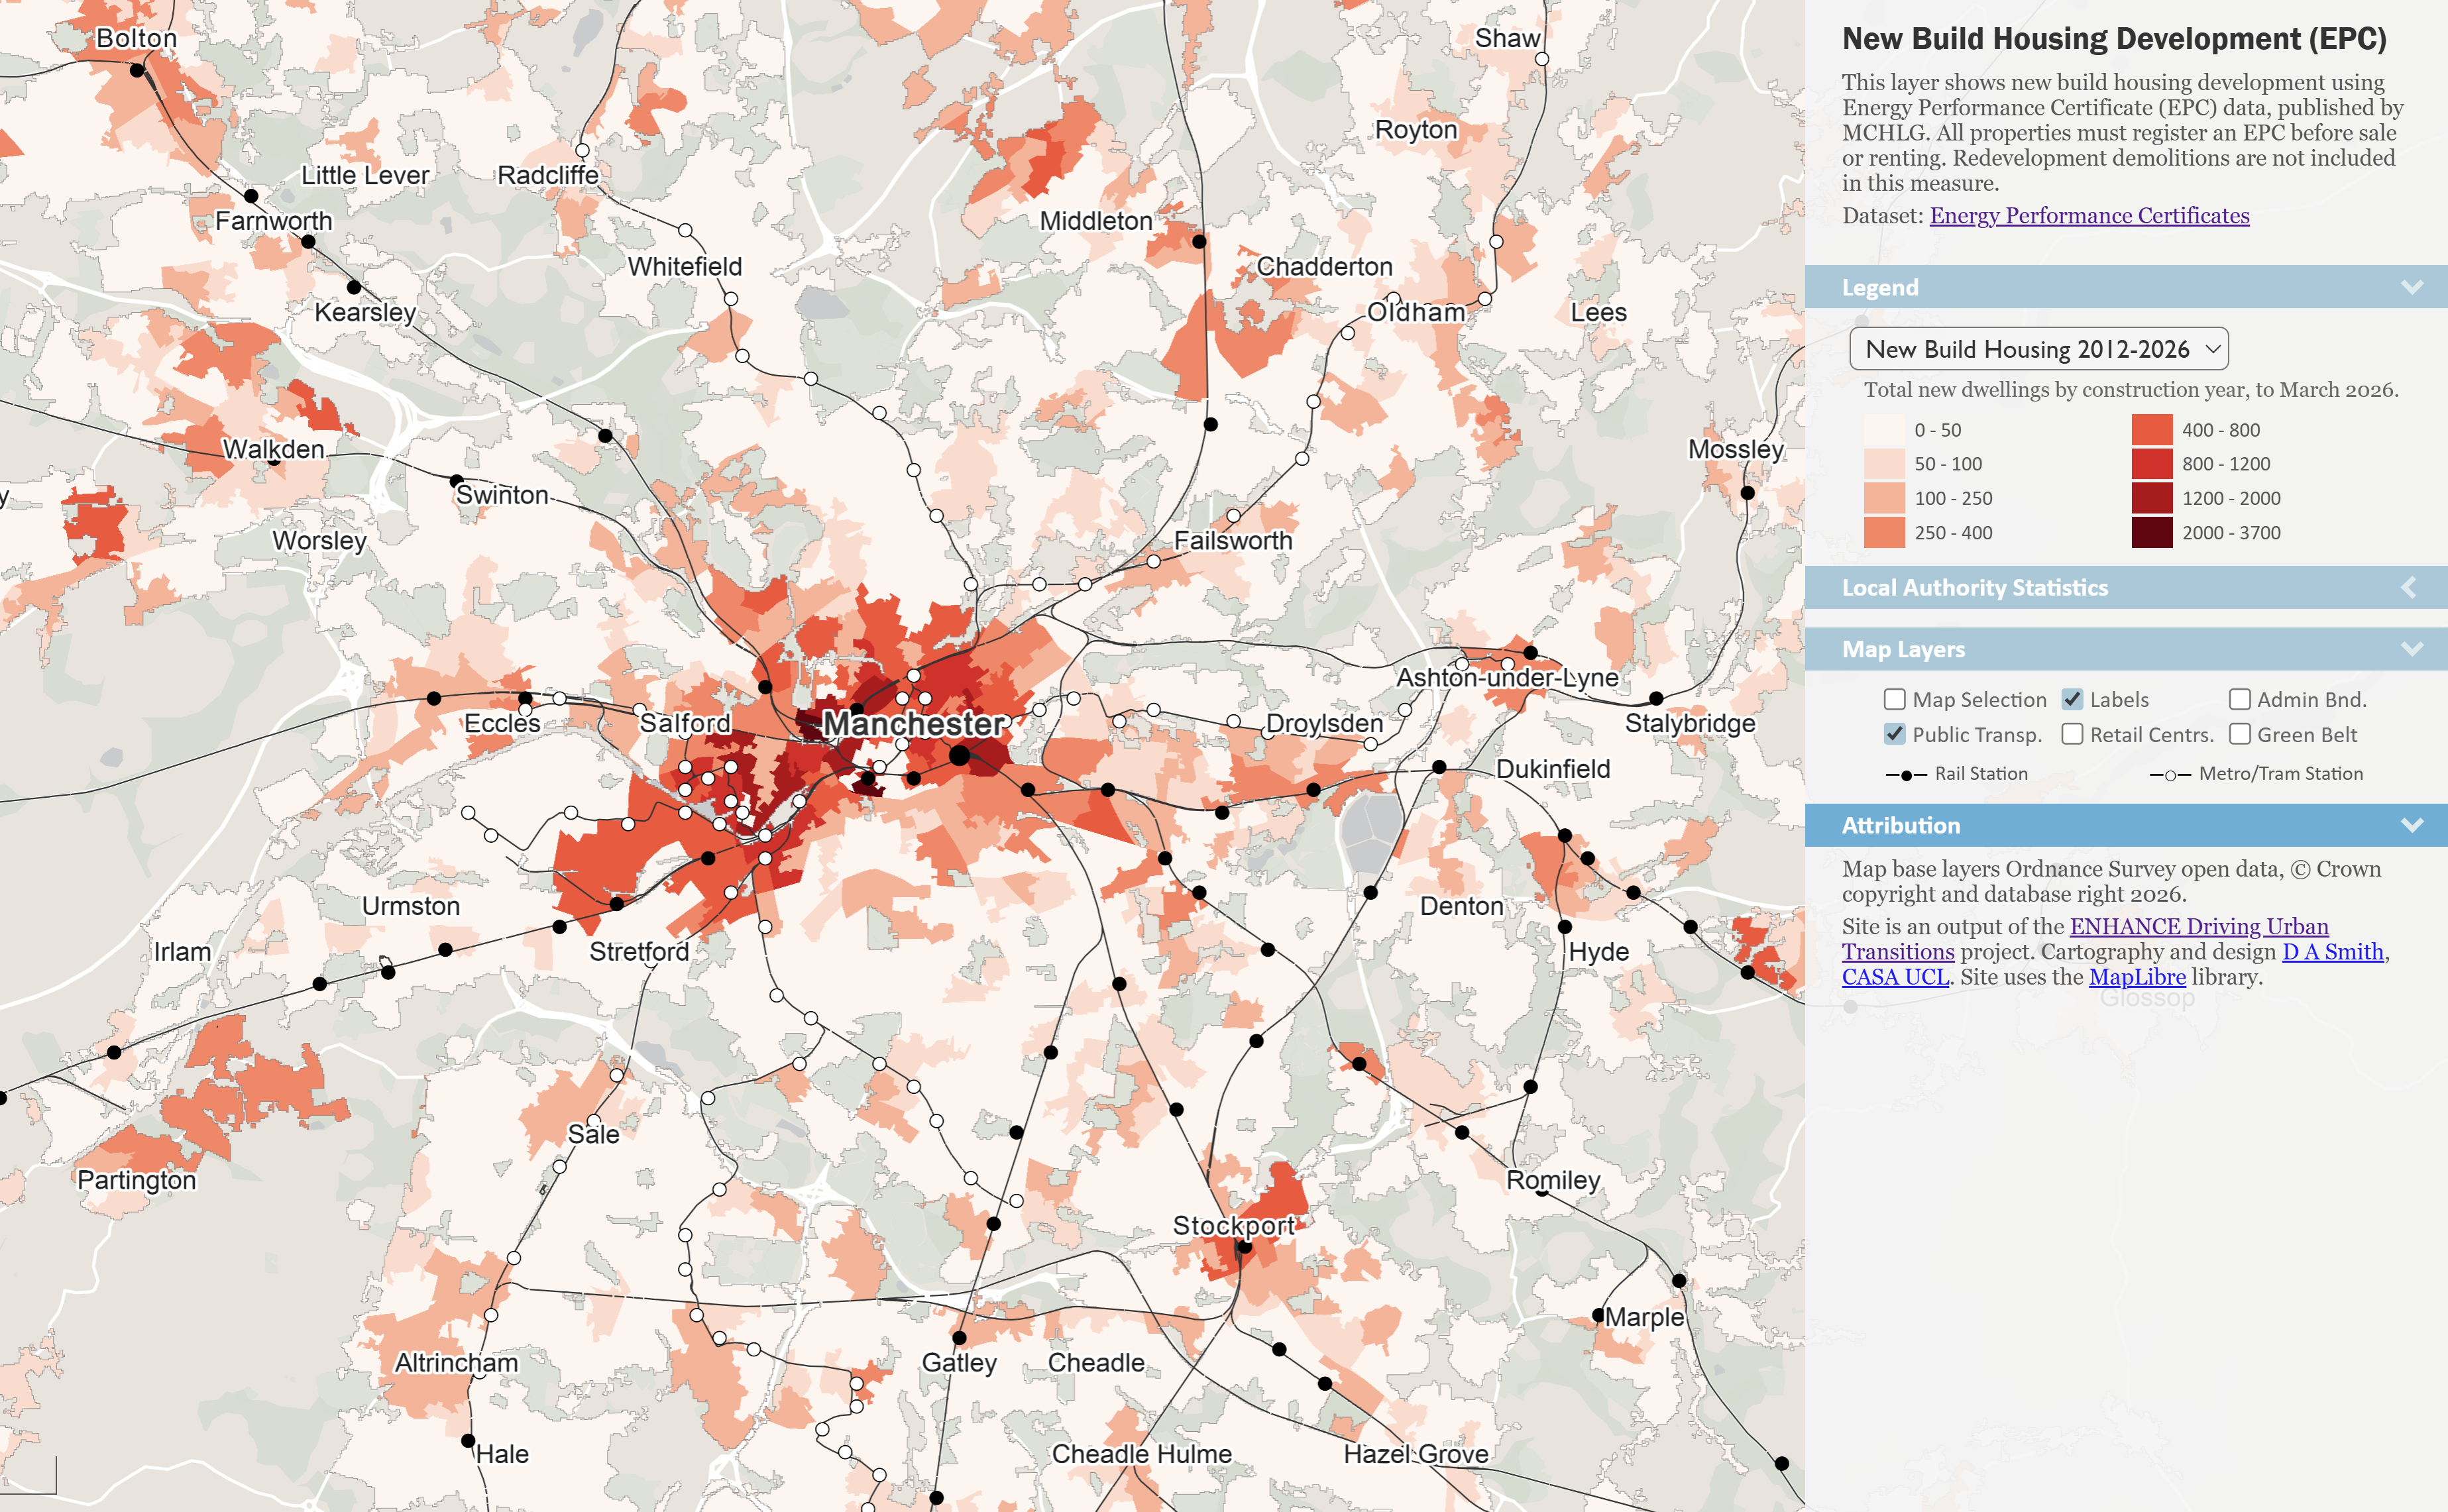
Greater Manchester is another good example of transit oriented development, with densification in Inner Manchester and Salford closely following rail and tram stations. You can also see the sites of future major development such as in Trafford to the south-west of Salford-
Brownfield Sites Analysis
As well as analysing completed development, we can also analyse sites of potential future development. MHCLG have been working to integrate Brownfield site data for England and Wales. We can chart the authorities with the greatest potential for housing development on Brownfield land. Birmingham has by far the greatest potential for brownfield development, with an estimated 127 thousand dwellings. Note the chart shows estimated housing for all brownfield sites on the y axis and estimated housing for brownfield sites that do not yet have planning permission on the x axis (62k in the case of Birmingham). Birmingham is followed by northern cities including Leeds, Bradford, Salford, and several Outer London boroughs. Note a significant number of authorities were missing in this dataset as of July 2026 and appear on the far left-hand side of the chart-
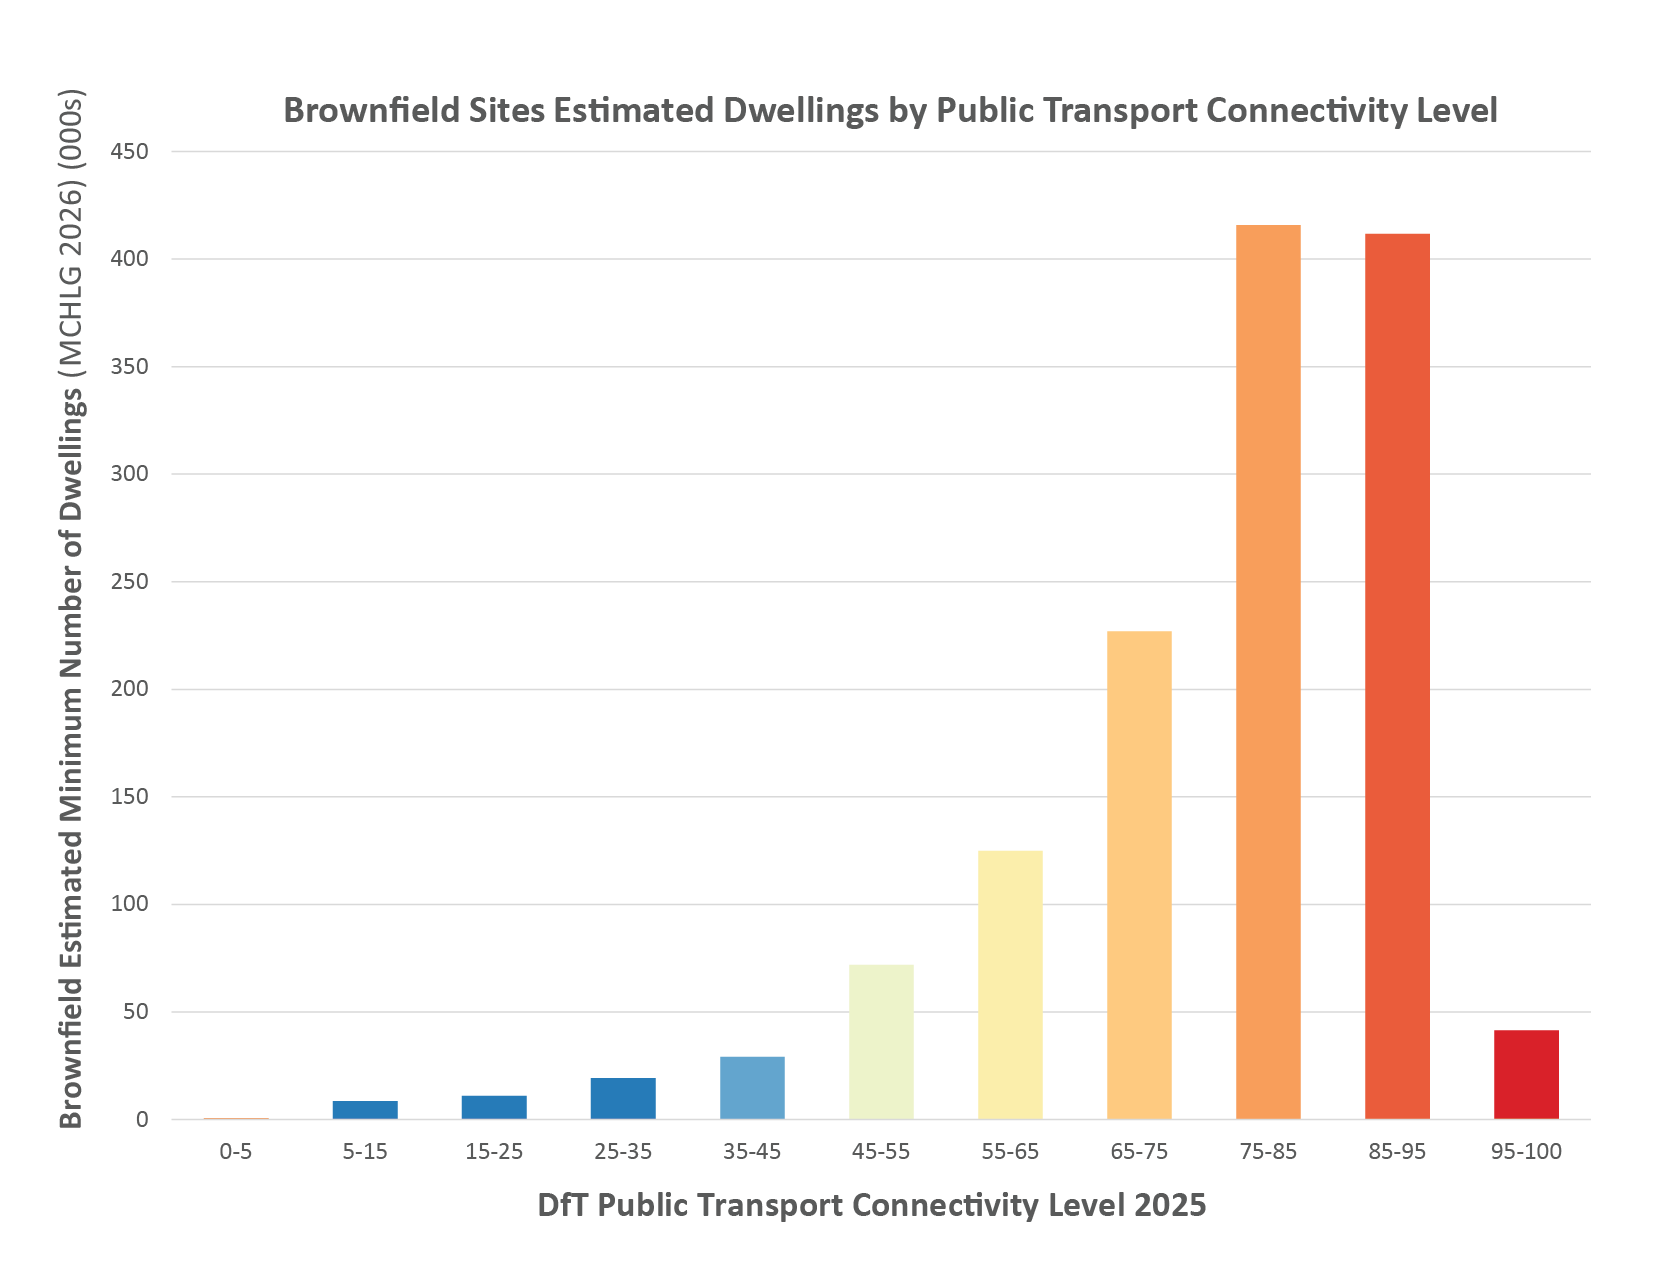
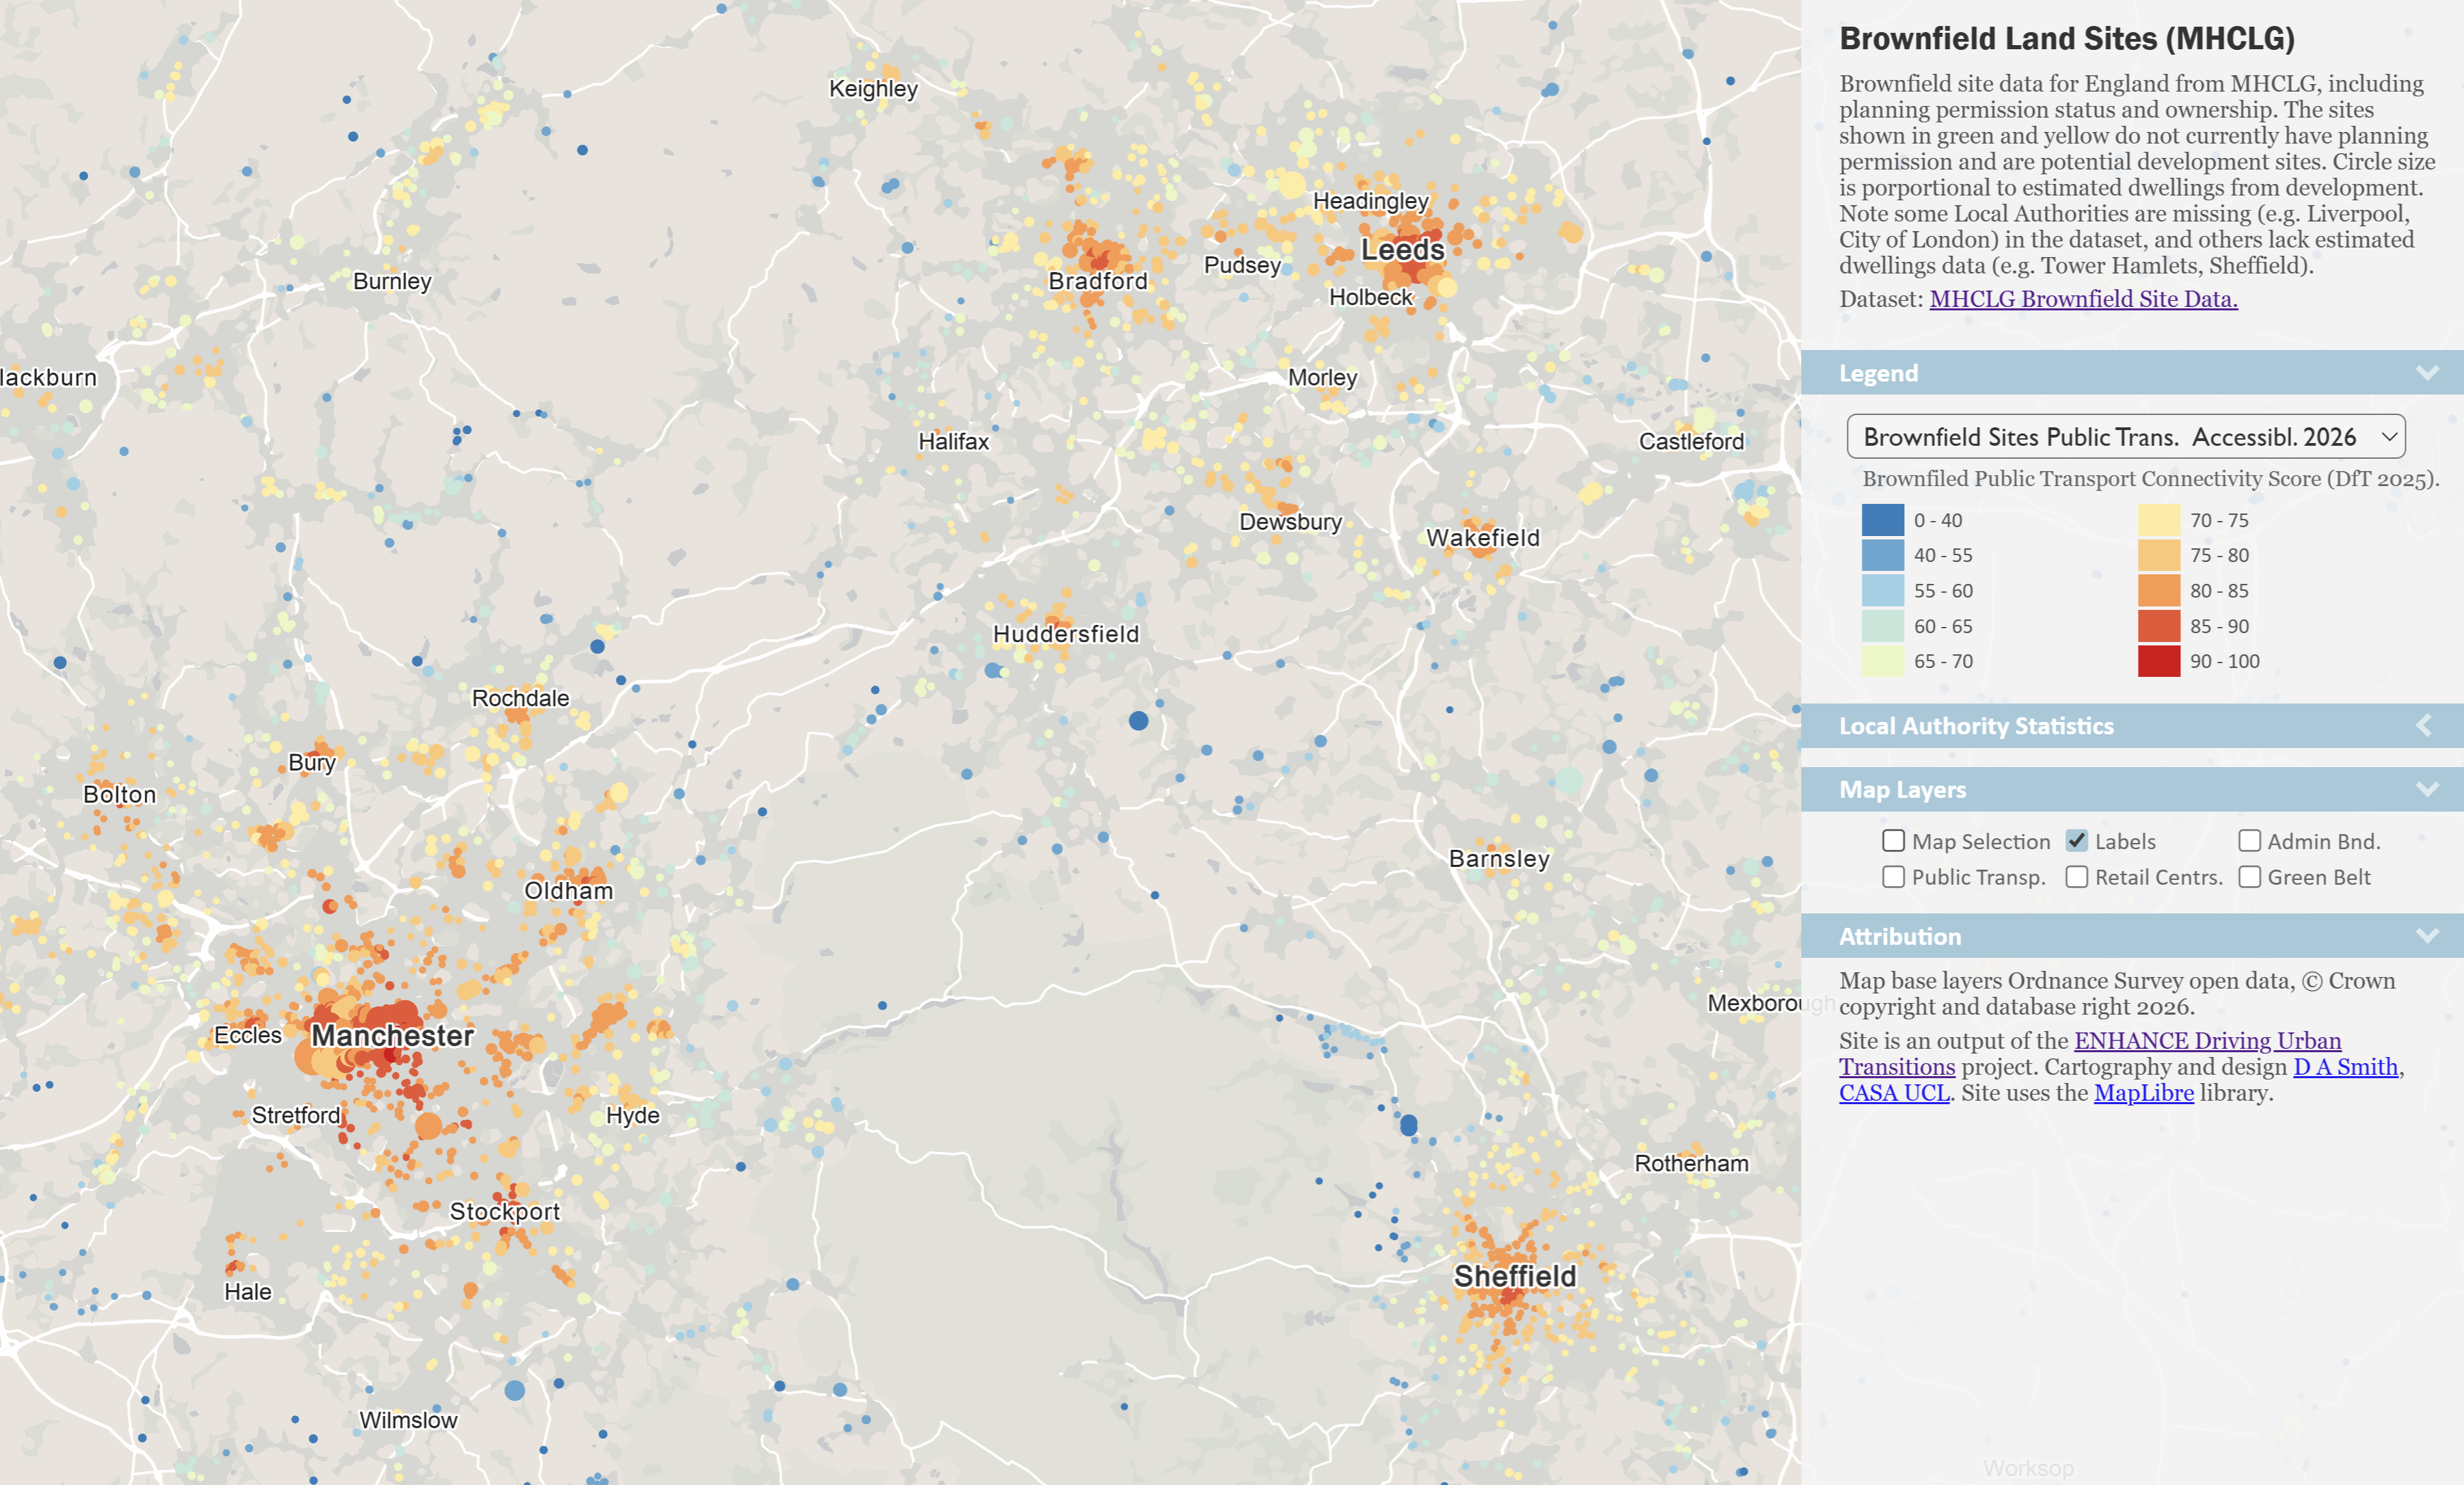
The Brownfield analysis confirms that there remains the potential for large volumes of housing on brownfield sites, with the total estimated dwellings for all sites in England and Wales adding up to 1.4 million dwellings. Sustainable development principles prioritise brownfield development as these sites are typically located in urban areas, connected to population and services by public transport. We can confirm that the majority of Brownfield sites are integrated with current public transport infrastructure by combining the brownfield site data with the DfT Public Transport Connectivity Metric to show that the majority of Brownfield sites are in accessible locations with Public Transport Connectivity scores of 75 or higher-
Green Belt Development Debates
While Brownfield development remains the priority, it is likely that on its own, it will be insufficient to meet the ambitious housing targets in place to address current housing shortages in England and Wales. There are ongoing debates around Green Belt development and the appropriate balance needed to meet housing needs. Green Belts have been in place for nearly all major city-regions in England for more than half a century, with the original aim of restricting urban sprawl.
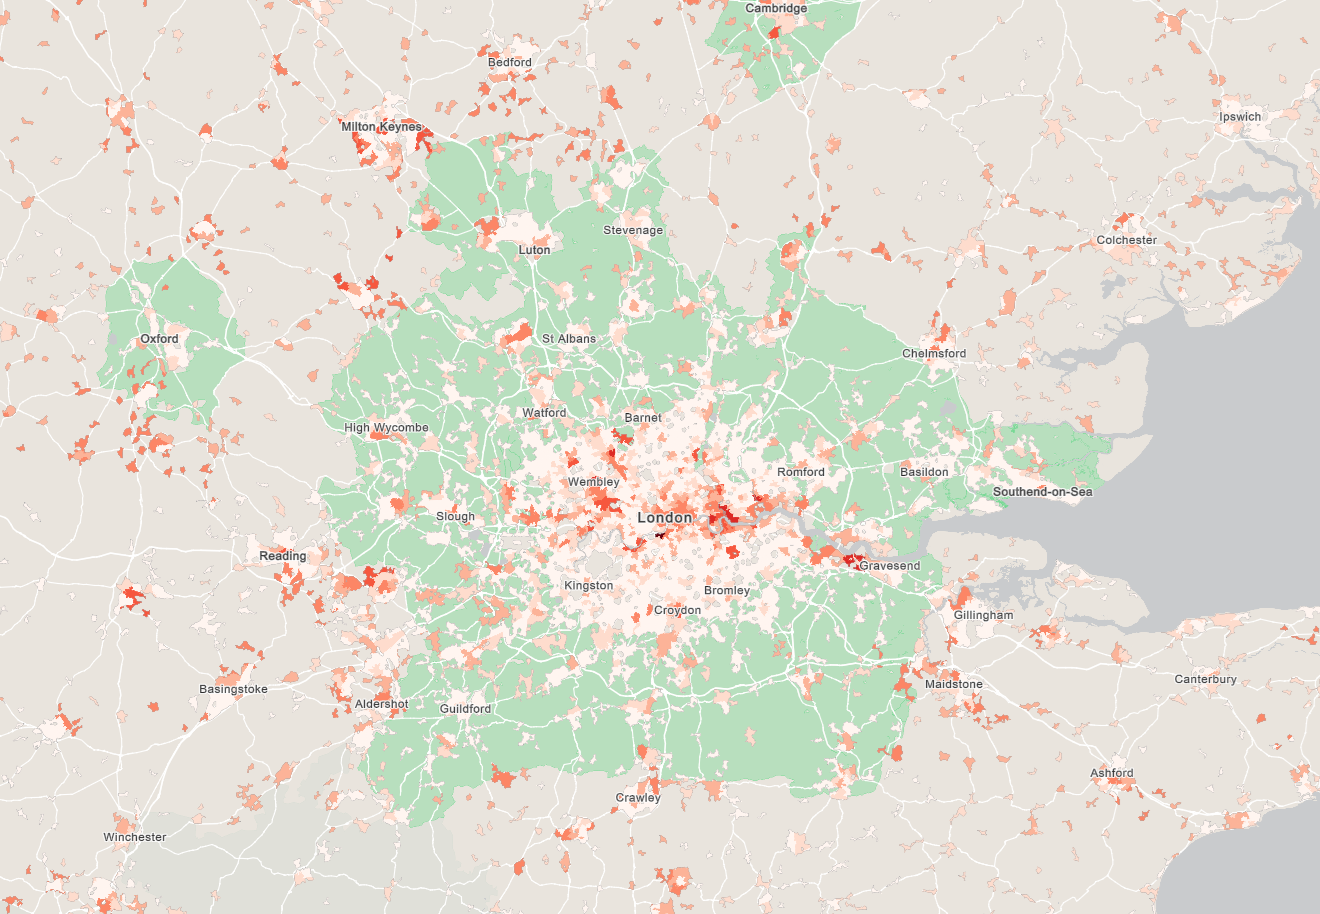
Green Belt planning policy has been very effective in restricting development, with an unintended consequence being to push lower density development further out beyond the Green Belt boundary in South East England. We can see this process through mapping the EPC new build data 2012-26 with development occurring just beyond the Green Belt boundary-
Any release of Green Belt land for development should be coordinated with public transport infrastructure. This has been the direction of recent government policy, with the new NPPF facilitating development within 800m of rail stations around major cities. The Mapping Tool shows potential Green Belt sites within an 800m buffer of stations, excluding protected sites and high flood risk areas-
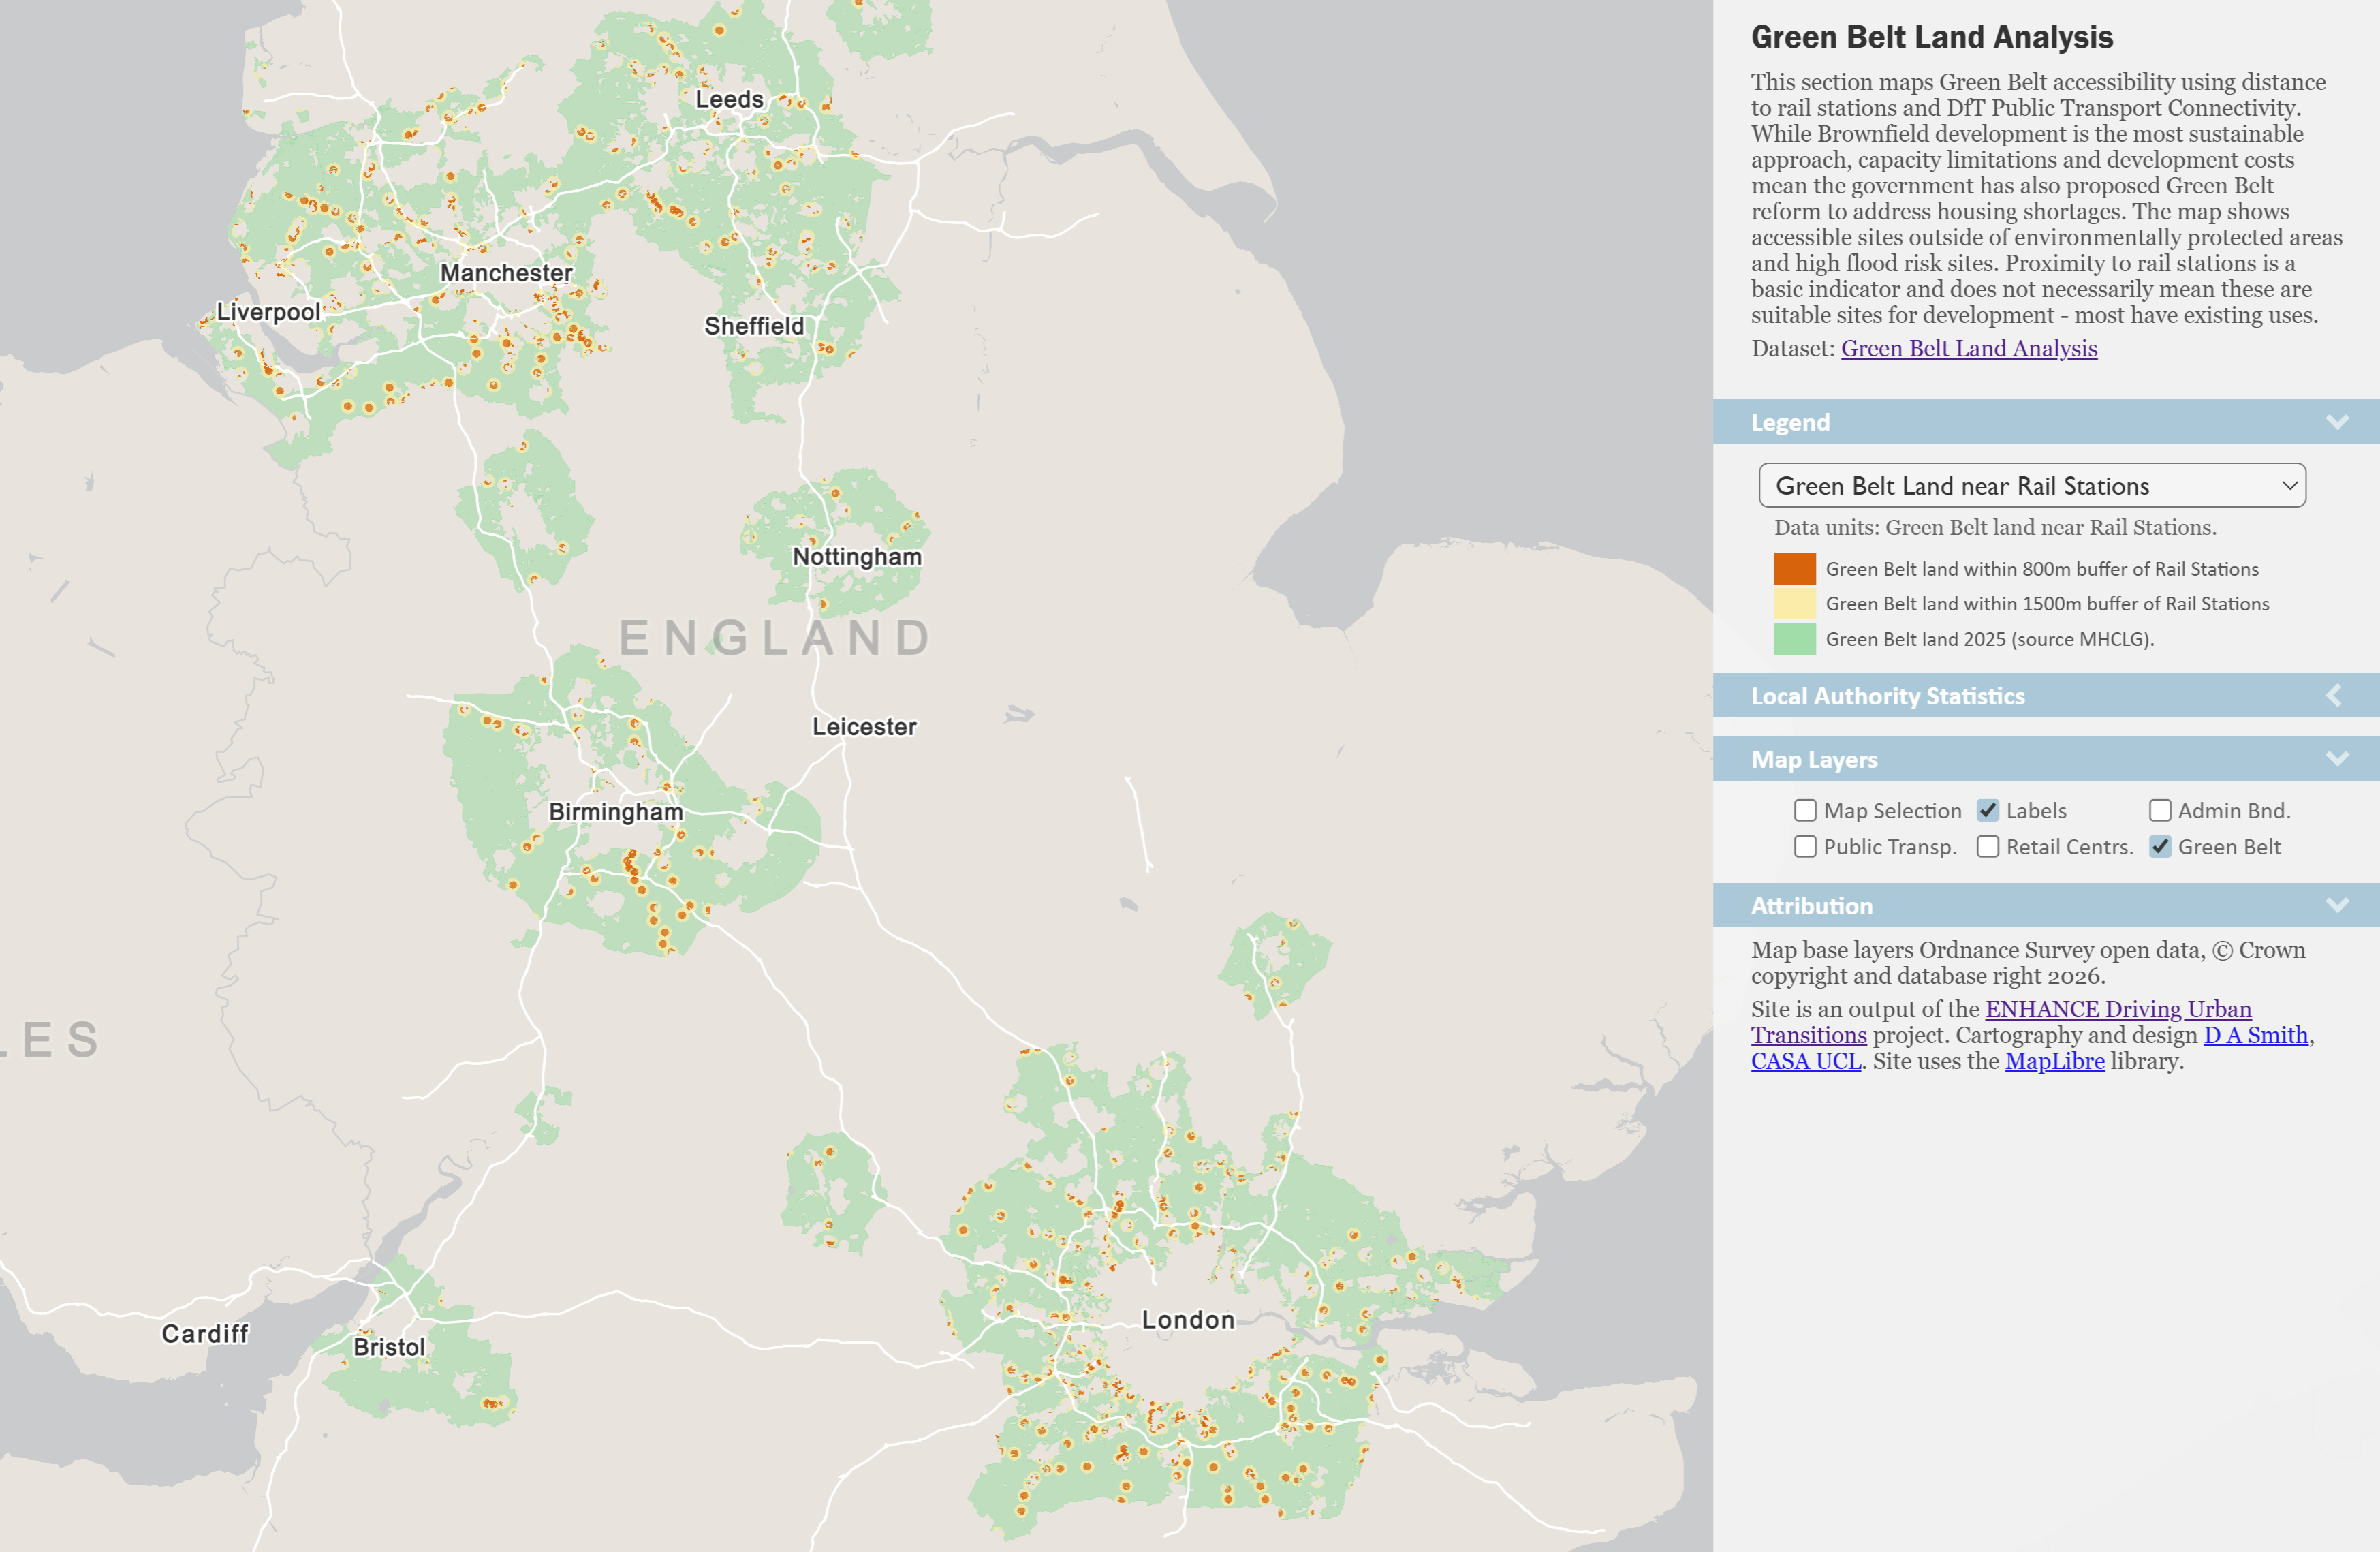
The land area in these sites has the potential for hundreds of thousands of homes, though the development reality is likely to be more complex both from the political perspective and in terms of sustainable planning, as many of these sites are quite isolated. Zooming into these sites, they are a mix of some promising development areas with others with existing uses that are unlikely to be suitable for development. For more information on travel sustainability and Green Belt development, see this open access paper in the Cities Journal. For more information on recent government policy from the NPPF on priotising development around rail stations, there has been good recent commentary and analysis from Litchfield Consultants.
The ENHANCE Project is funded by ESRC and is part of the Driving Urban Transitions network. |
 |
 |
 |
 |