Active Travel and the 15 Minute City
Measuring Local Accessibility
Local accessibility considers the ease of reaching key travel destinations over shorter travel times and distances. Local accessibility is important for facilitating active travel — walking and cycling — which can have substantial health and environmental benefits for communities. It is also relevant for public service and local planning.
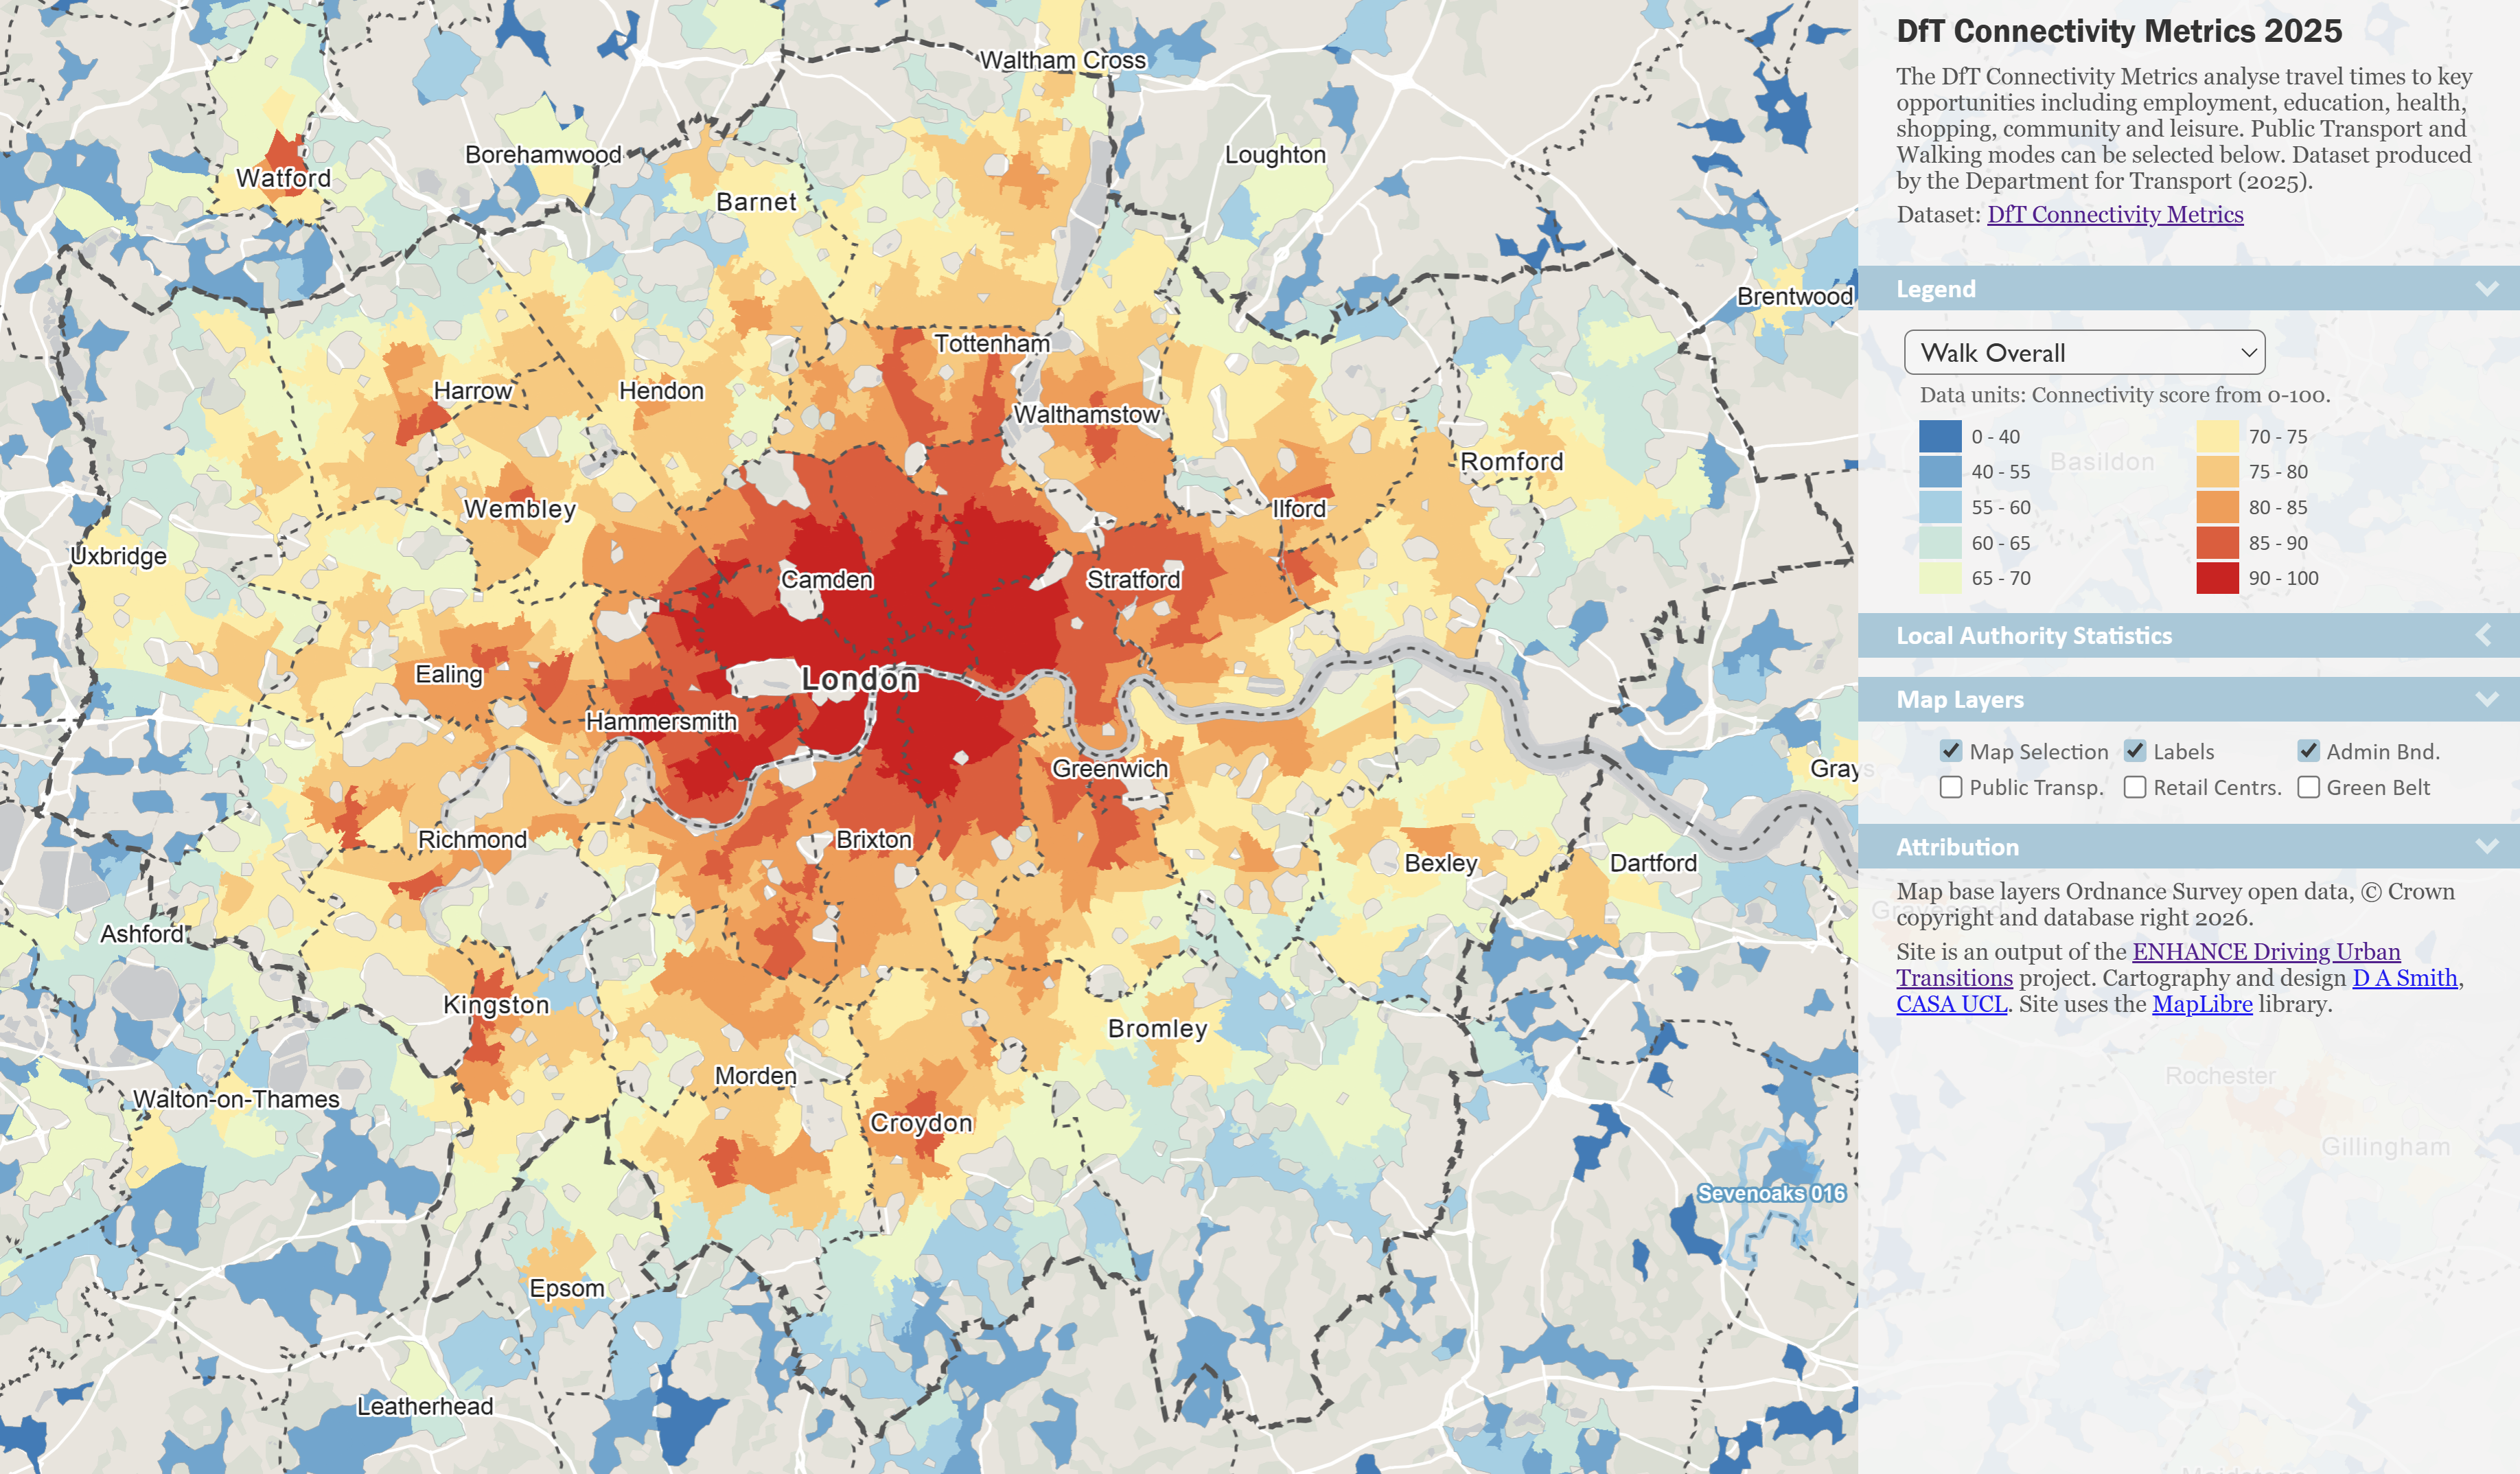
In our first article on Accessibility and Travel Sustainability we used the DfT Public Transport Connectivity metric as a measure of overall sustainable accessibility for both regional and local trips. We can use the DfT Walking Connectivity Metric as a measure of local accessibility. The Connectivity metrics use National Travel Survey data to set impedence functions by travel mode and destination type, which means that the Walk Connectivity metric is weighted towards typical walking trip durations, i.e. average of 18 minutes, and therefore provides a local accessibility measure.
We can repeat the England city regions chart for the DfT Walking Connectivity Metric. The results are similar to the Public Transport measure, favouring large cities. The close relationship between Walking and Public Transport Connectivity is confirmed in the scatterplot showing a strong correlation between these two accessibility measures. This result makes sense as cities that have good public transport accessibility tend also to have relatively high densities and mixed-uses, which enables walking accessibility-
The Walking and Public Transport Connectivity Metrics are similar but not identical, and the differences can be revealing. Walking accessibility increases with high urban densities, and English cities with dense urban cores have higher results, such as Bristol and Liverpool. The local authority with the highest Walking Connectivity outside of London is Portsmouth, reflecting its compact high-density form due to its island geography. Coastal towns in general tend to have stronger local accessibility than regional accessibility, and this can be seen in the local authorities sitting above the trendline in the scatterplot, such as Exeter and Blackpool. Note the DfT measure does not include Scottish cities, and it is likely that Glasgow and Edinburgh would perform highly with both Connectivity measures due to historic high-density inner cities.
Another difference between the Walking and Public Transport Connectivity metrics is that London boroughs have a wider spread of results for Walking Connectivity. This is because Outer London boroughs score relatively highly for public transport, but have medium densities, which results in lower walking accessibility. You can further explore the Walking Connectivity Metric on the Mapping Tool-
Local Accessibility and Destination Types
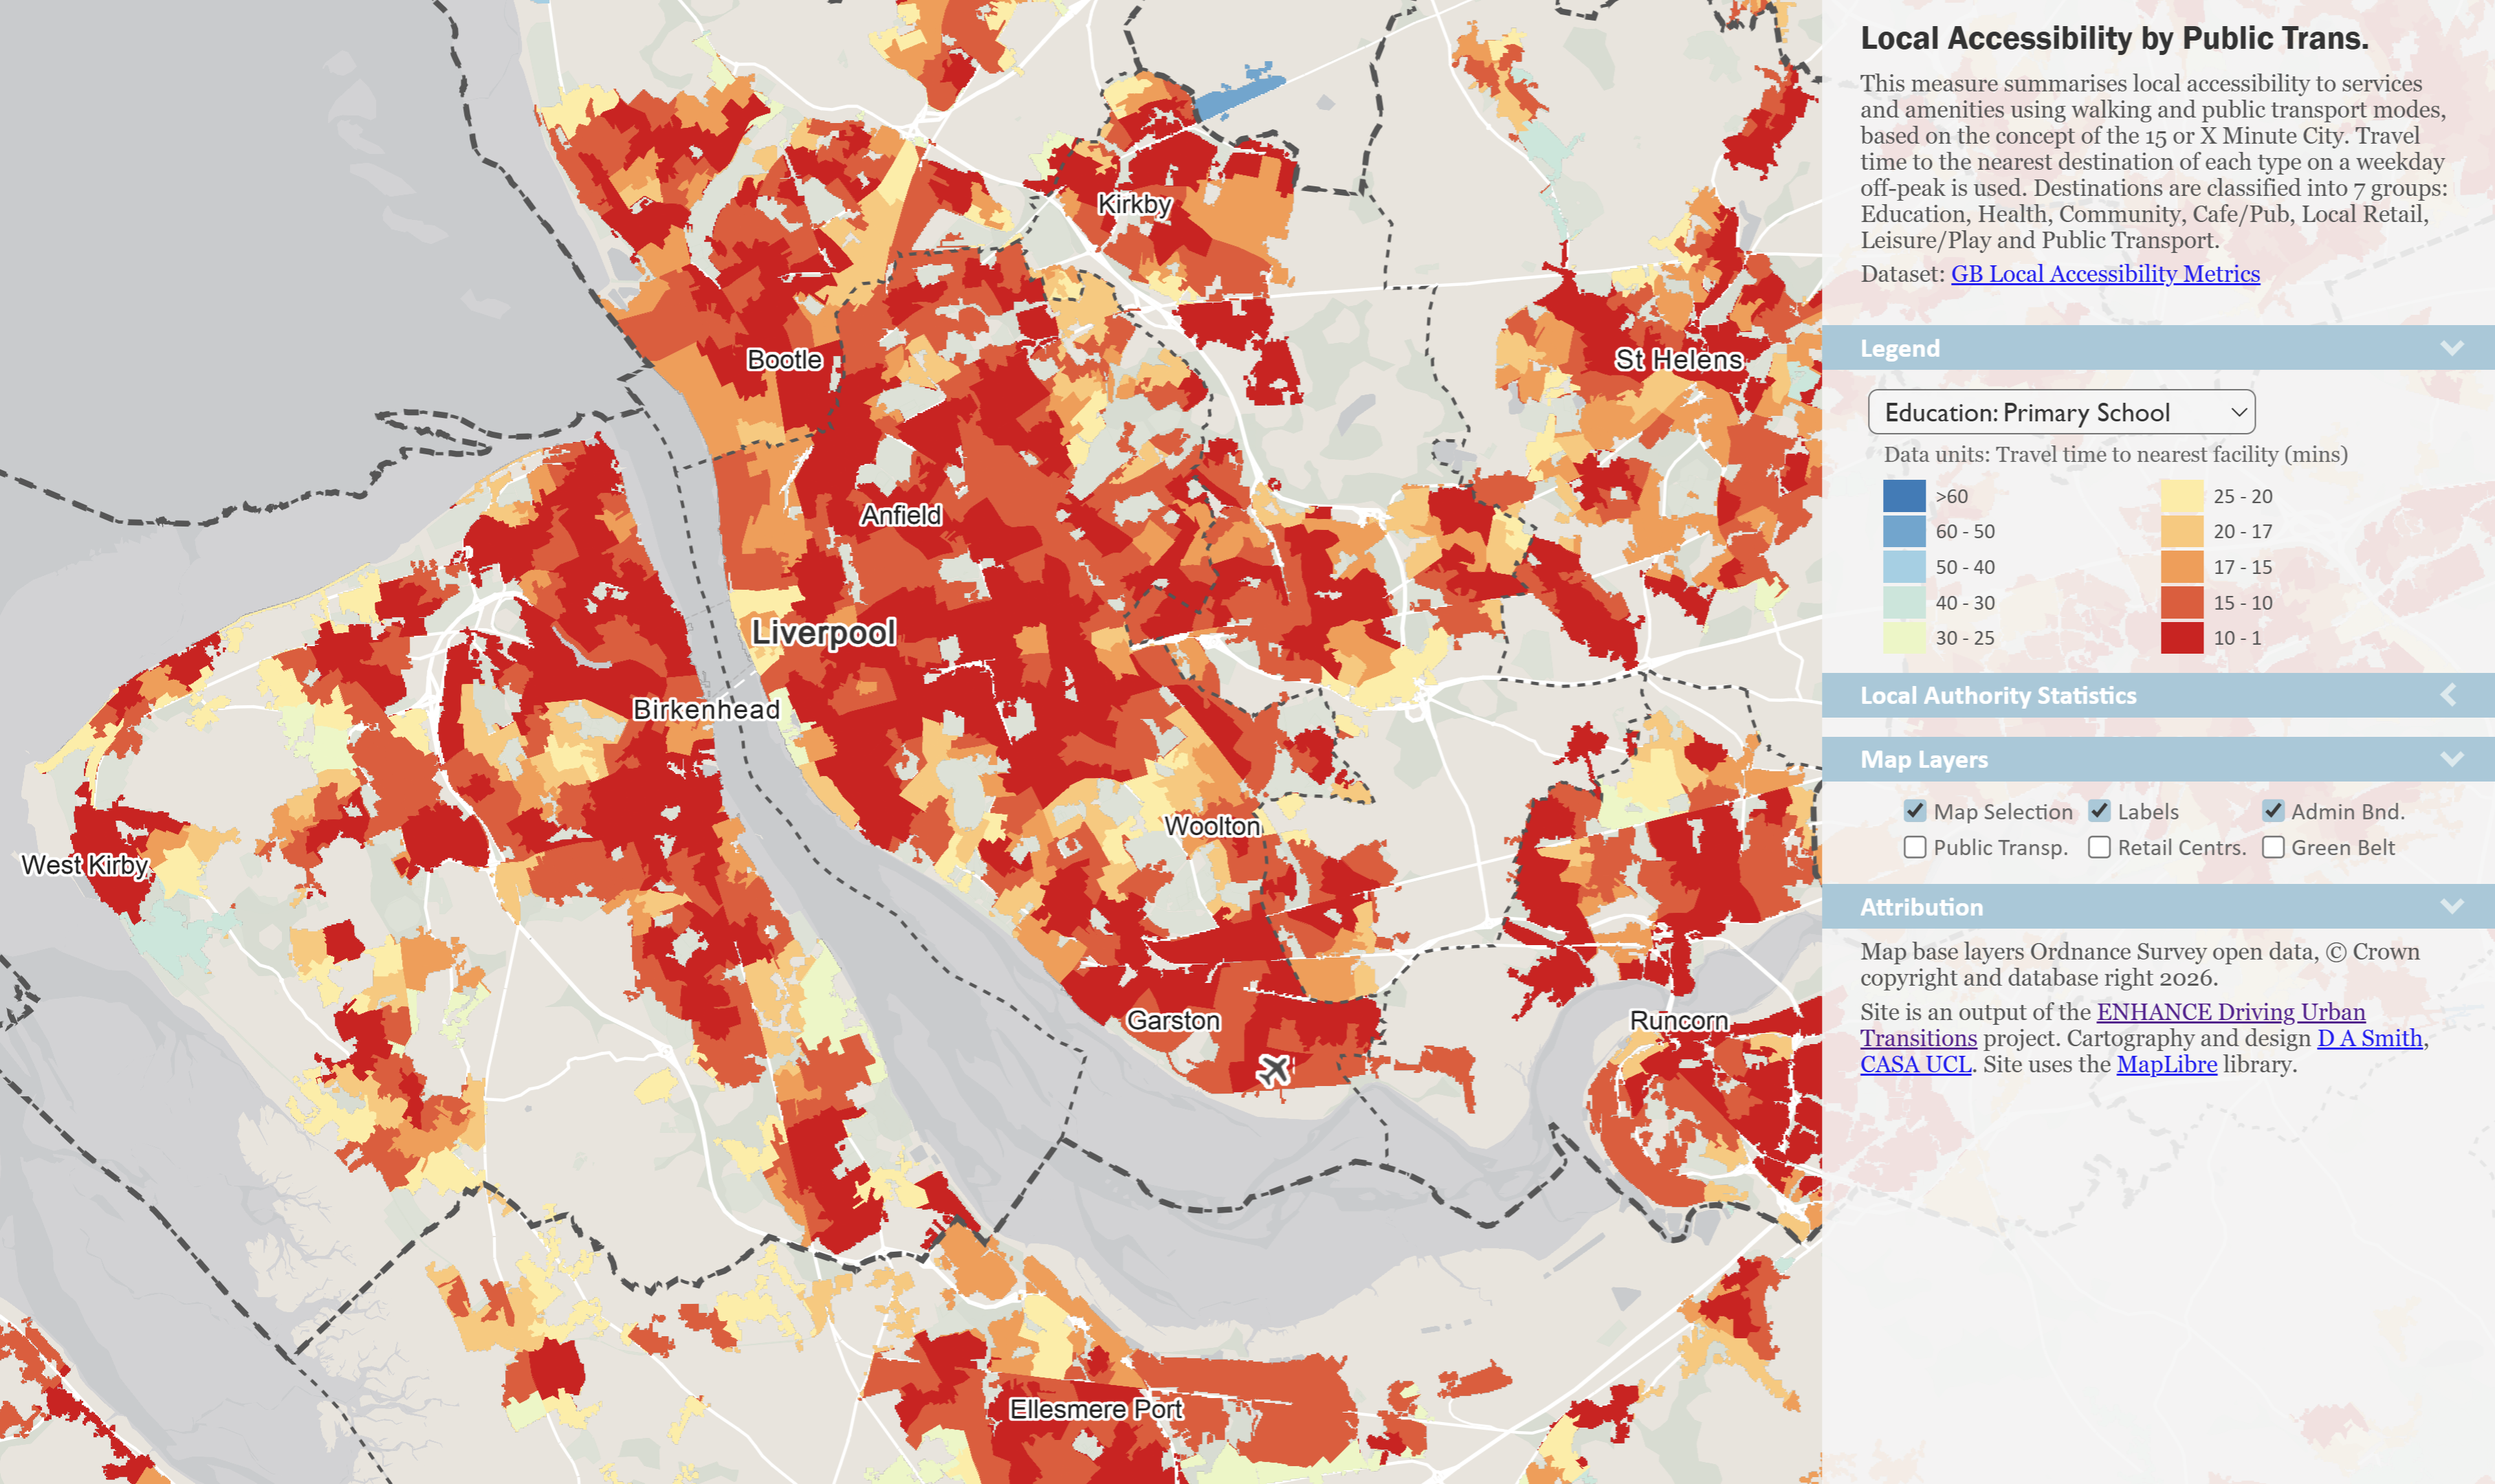
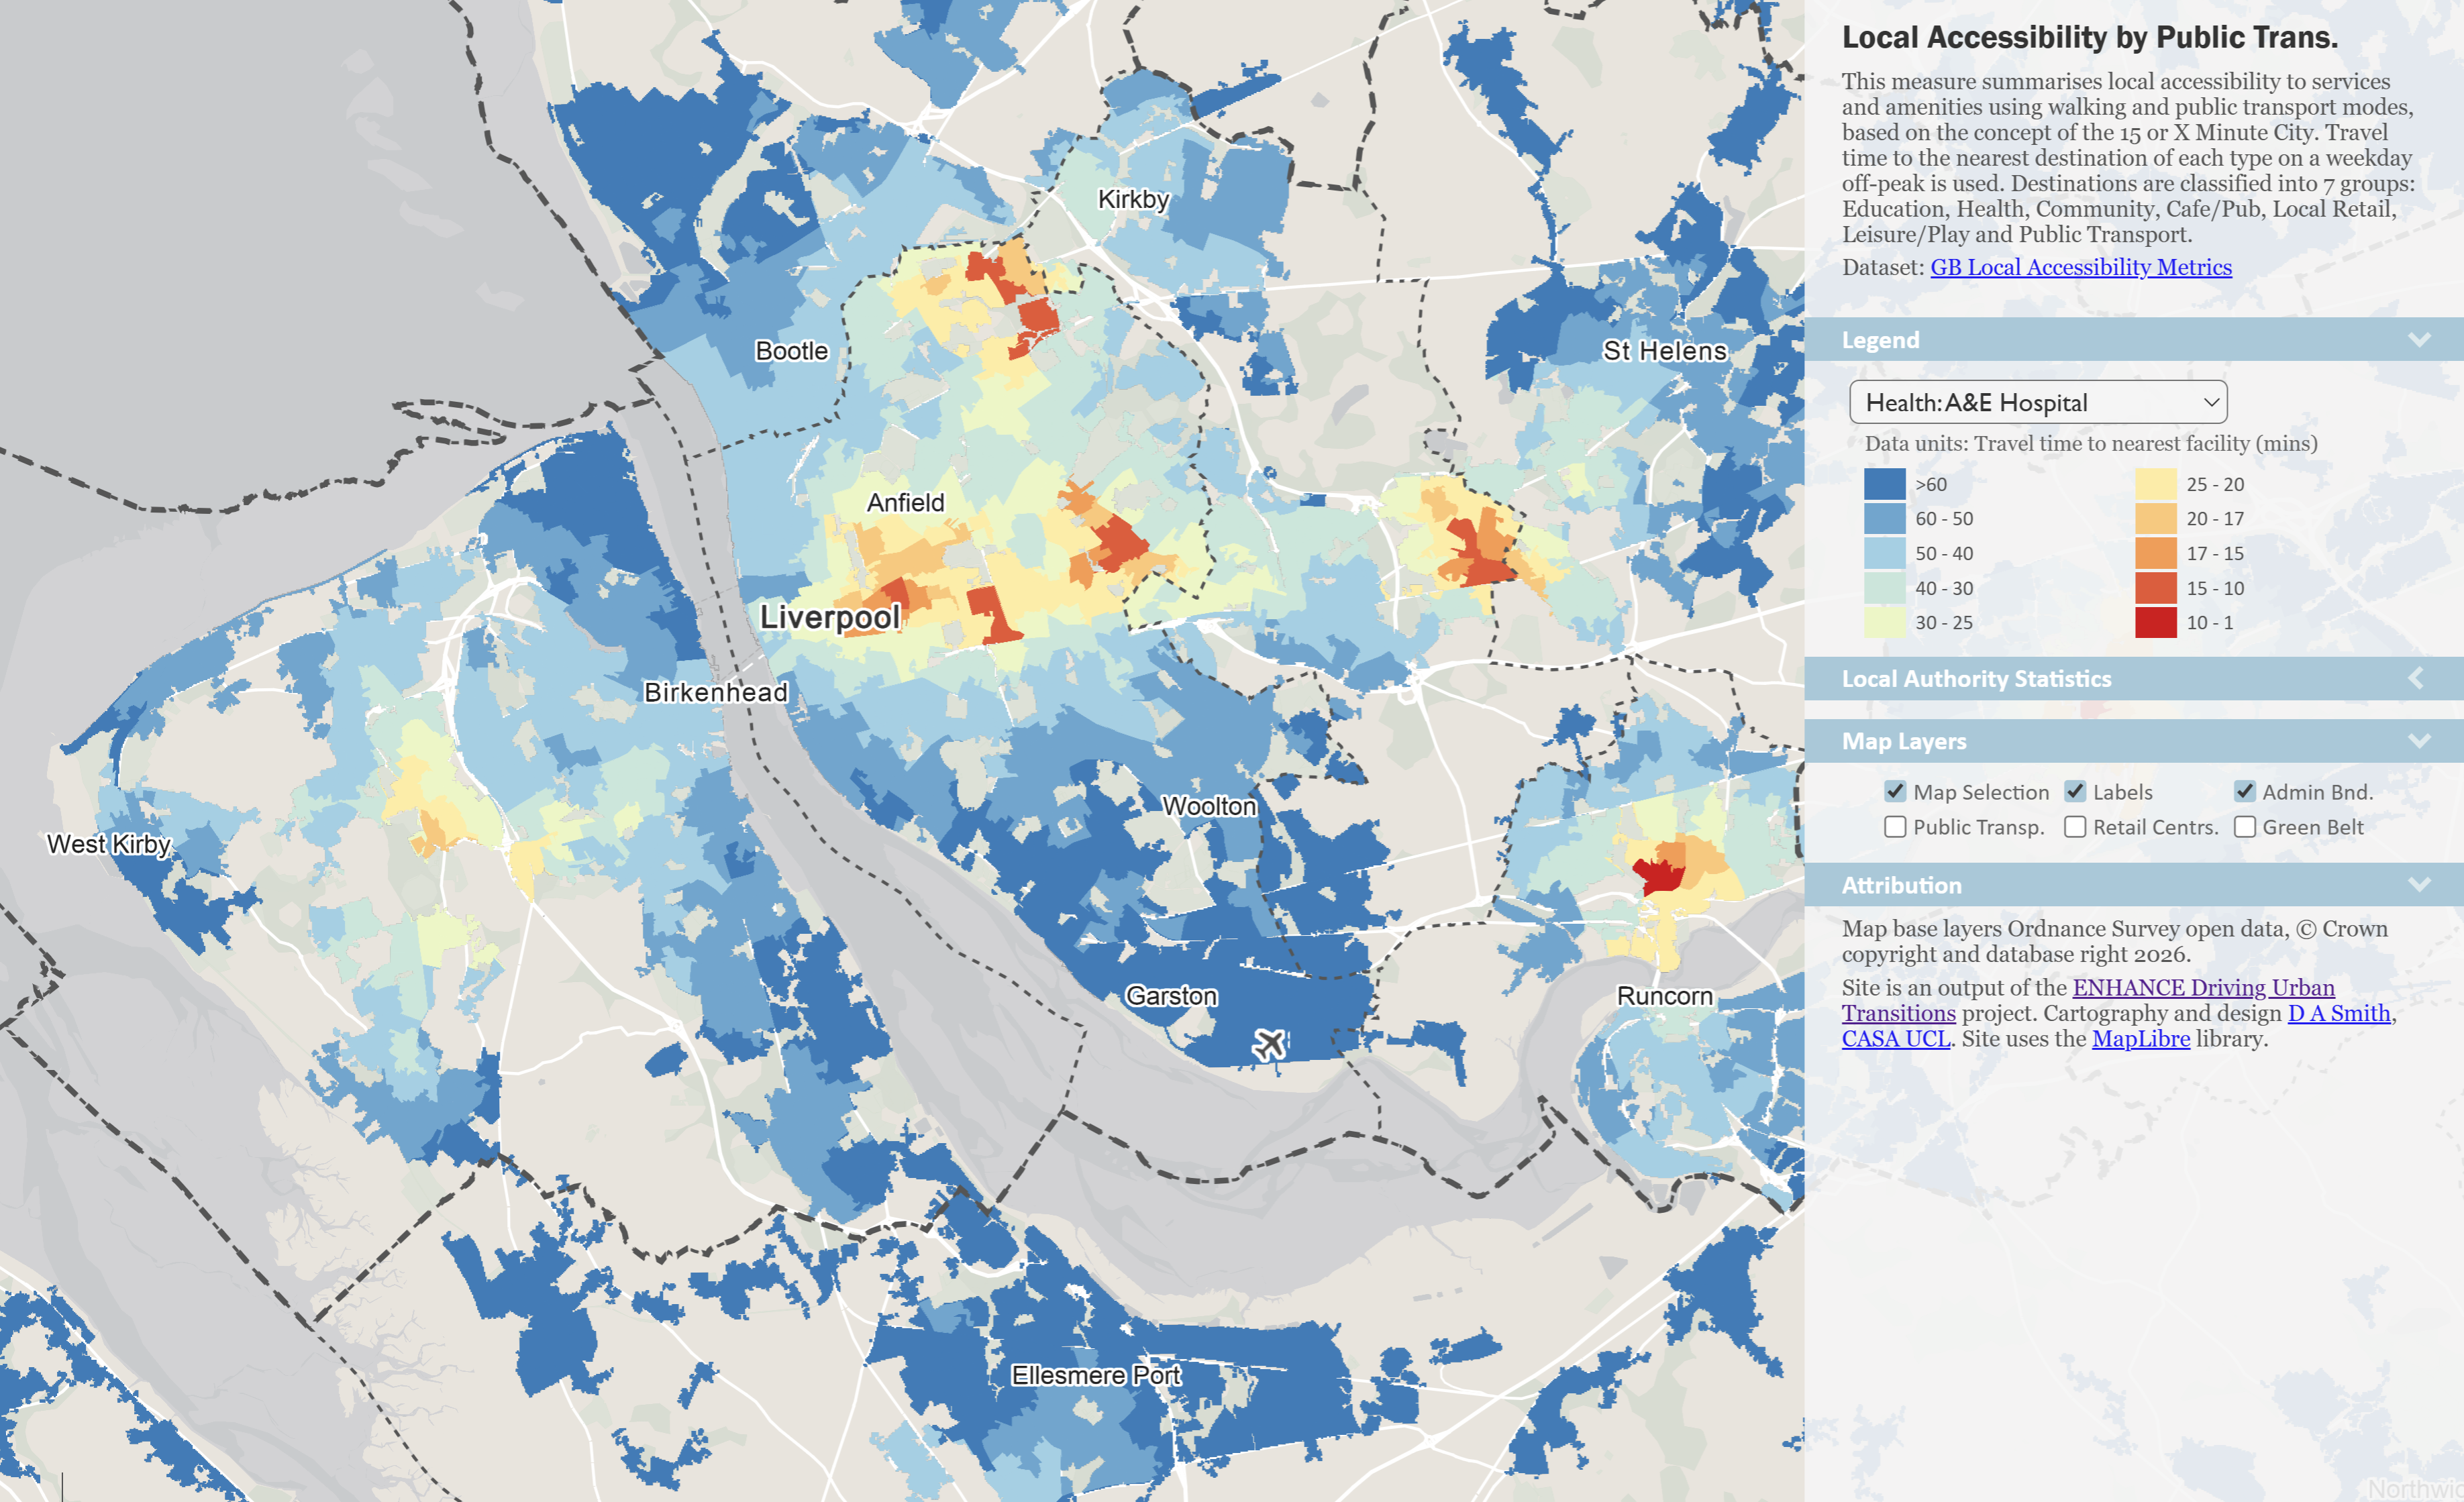
Accessibility measures can also be explored by different types of destinations. The original concept for the 15 Minute City advocated that all travel needs could be met in local areas. There are however significant differences in accessibility between destination types, depending on how ubiquitous and widely distributed destinations are. Local retail and school accessibility are examples of frequent and widely distributed destination types that can be accessed by short walking and bus trips in nearly all urban areas. While destinations such as hospitals and large business agglomerations are examples of highly specialised and much rarer destination types that cannot be accessed locally for most of the population.
The ENHANCE Mapping Tool includes a Local Accessibility measure, which is based on the travel time to the nearest facility by public transport and walking for 40 types of common travel destinations, grouped into seven categories: Education, Health, Community, Cafe/Pub, Local Retail, Leisure and Public Transport. You can view travel times for each destination type by using the menu on the right-hand side. Below shows an example of Primary Schools, a widely available destination type, and Accident and Emergency Hospitals, a specialised and scarce destination type-
Cycling Accessibility and Cycle Infrastructure
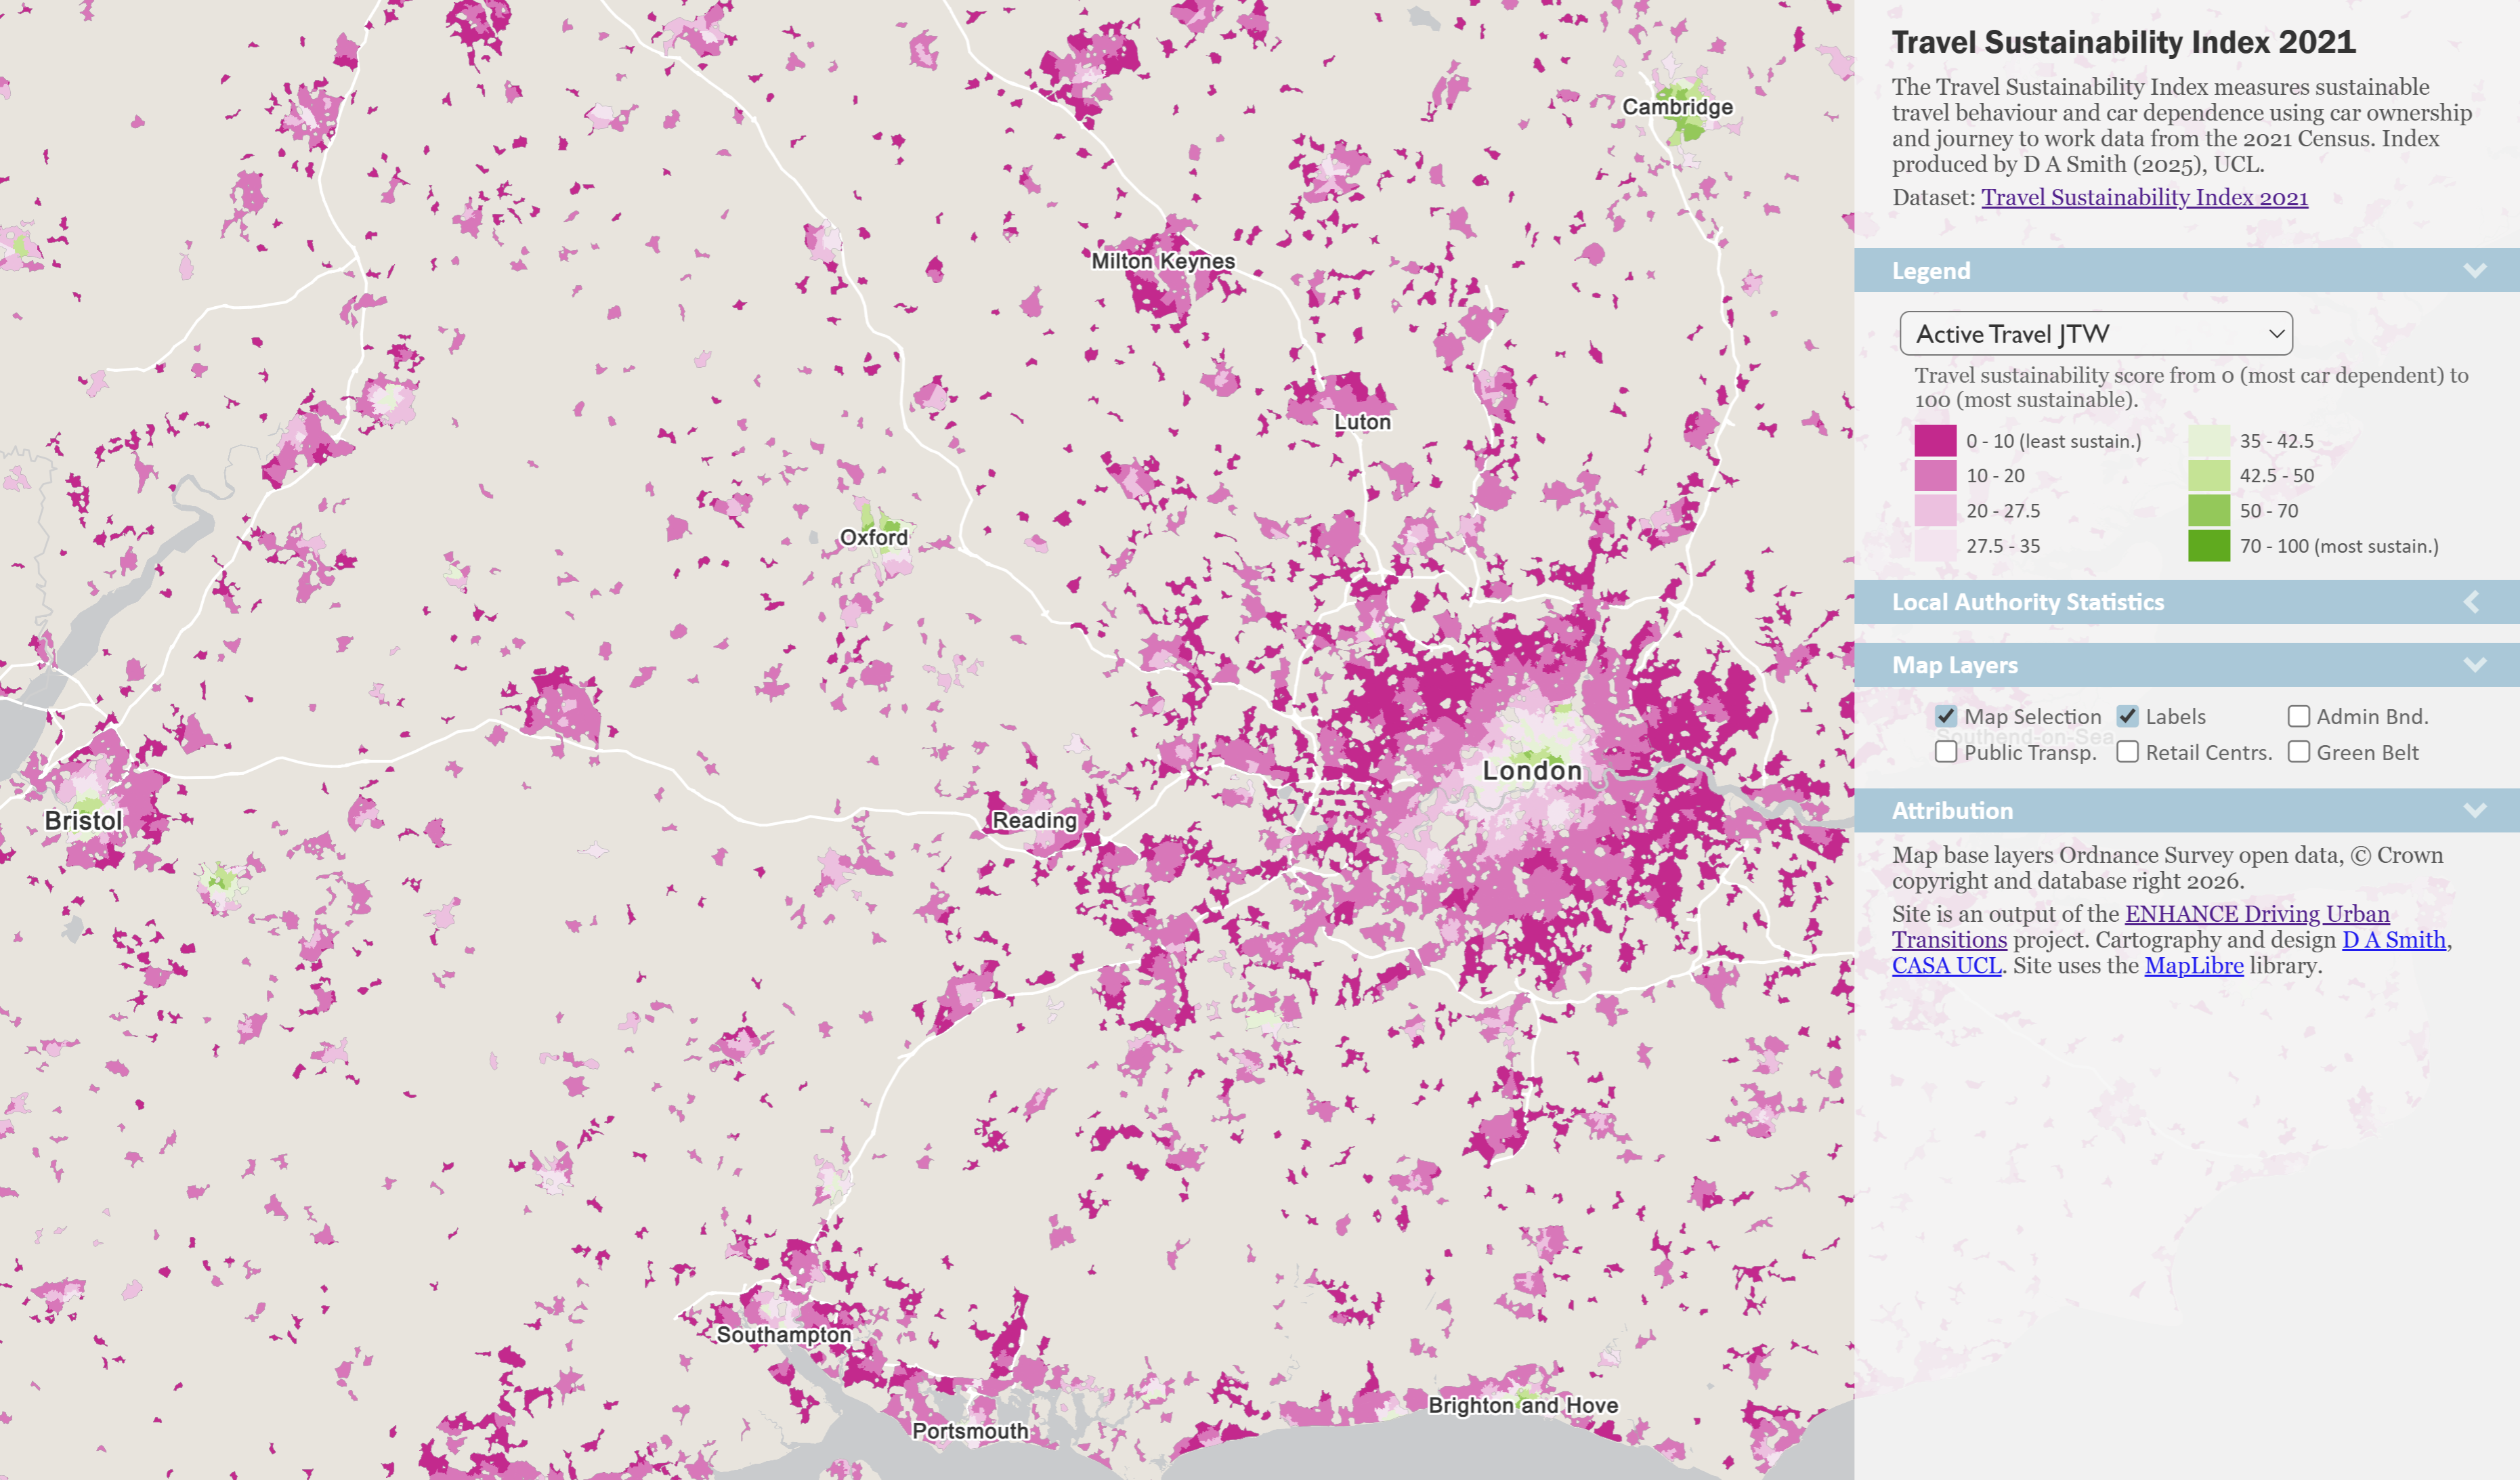
Walking accessibility is closely related to higher densities and mixed-uses. Cycle accessibility also benefits from higher densities and mixed-uses, but also depends on the quality of cycling infrastructure available. It is possible to have high rates of cycling at medium densities with good infrastructure, such as in Cambridge which has the highest cycling rates in the UK (31% commuting by bike in 2021), and it achieves this at medium densities with good cycling infrastructure. You can see in the Mapping Tool that high active travel rates are confined to a relatively small number of cities in the 2021 data (Cambridge, Oxford, Brighton, Bristol, Inner London), typically with high student and young professional demographics-
Measures of cycle accessibility need to consider cycling infrastructure, such as the presence of cycle lanes, and the conditions for cycling, such as road speeds. The ENHANCE Mapping Tool includes Cycle Infrastructure and Level of Traffic Stress for London-
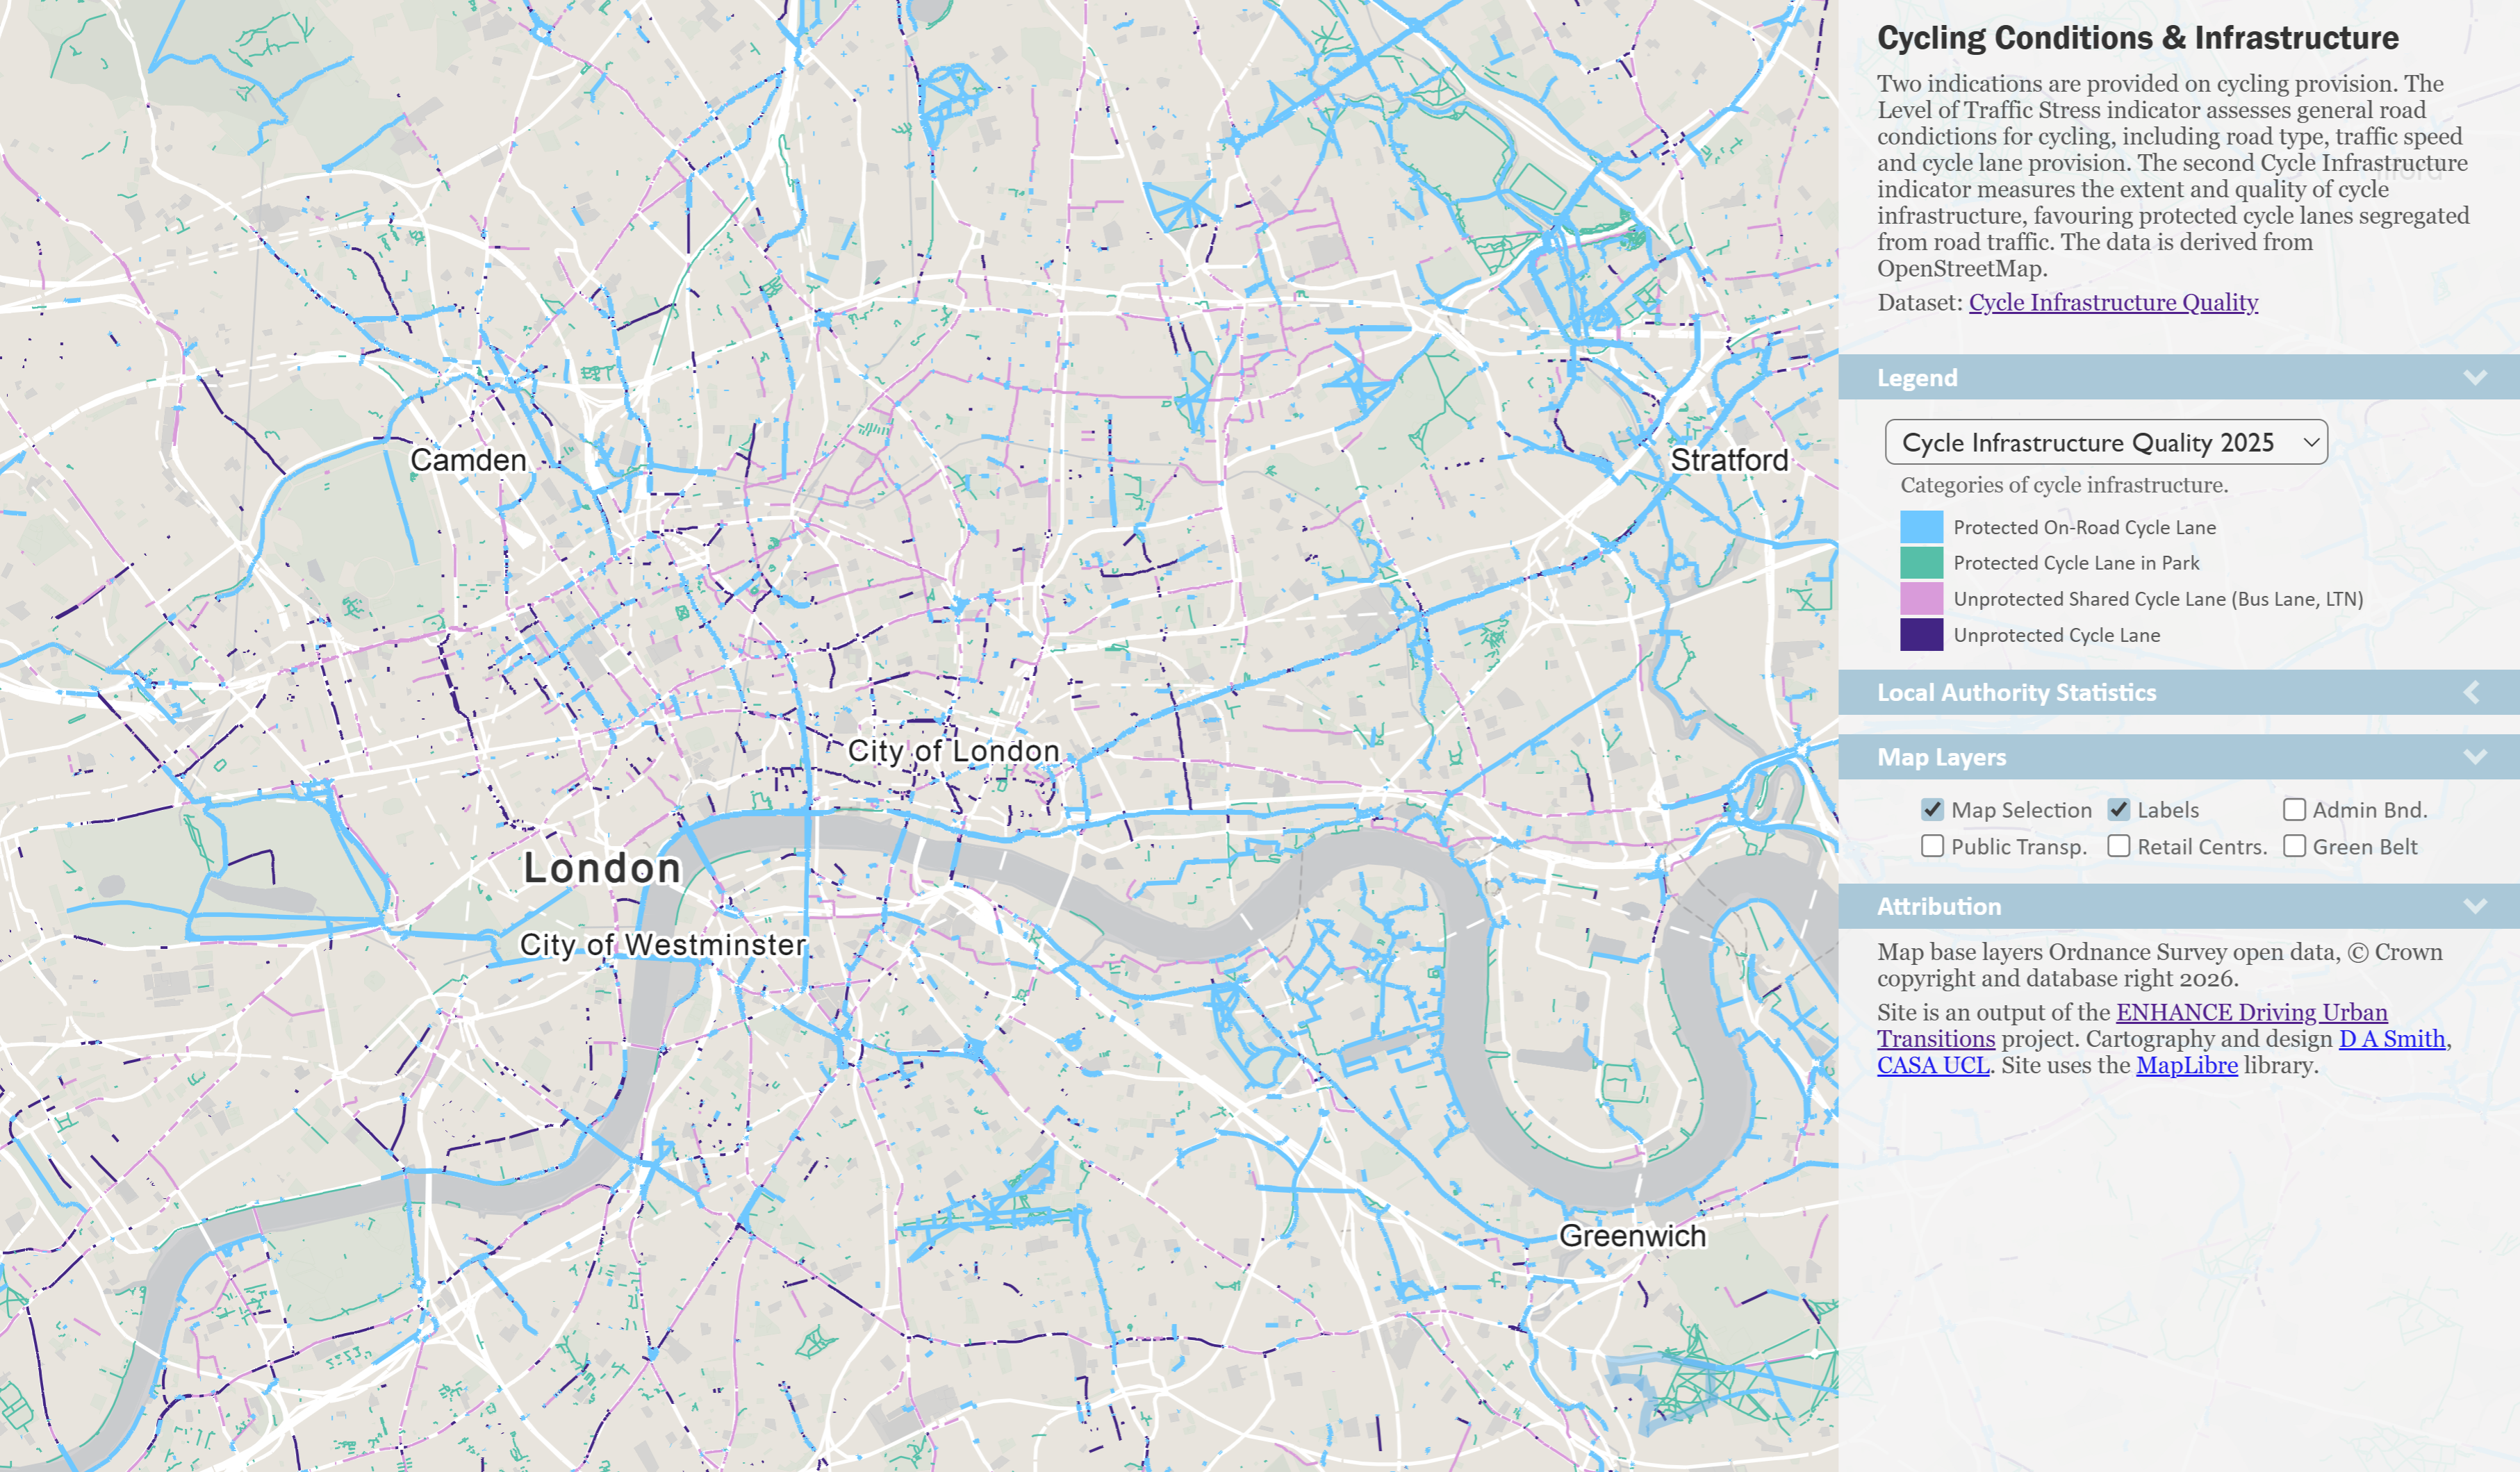
At the moment the Cycle Infrastructure data is for London only, but will be expanded to Great Britain at a later date. To find out more about the methodology to derive the cycle infrastructure data and Level of Traffic Stress from OpenStreetMap see this CityGeographics article.
Read the next article on New Build Development & Accessibility.
The ENHANCE Project is funded by ESRC and is part of the Driving Urban Transitions network. |
 |
 |
 |
 |